
Ontario Grade 2 Data Management Practice — Graphs and Charts Questions
Helping a Grade 2 student feel confident with numbers and pictures of data can feel like a big job. Yet when you break it down, Ontario Grade 2 data management practice becomes one of the most rewarding parts of the math curriculum. Children at this age are natural collectors of information—favorite colors, pets at home, how they get to school. Turning those everyday observations into clear graphs and charts teaches them to organize, compare, and talk about data with confidence.
This guide gives parents, teachers, and caregivers everything needed for effective Ontario Grade 2 data management practice. You will find clear explanations of the curriculum expectations, ready-to-use practice questions, step-by-step strategies, and answers to the questions families ask most often. By the end, you will know exactly how to turn simple tally marks into meaningful pictographs and bar graphs while keeping learning fun and low-pressure.
Why does this matter right now? Recent classroom observations from 2025–2026 show that students who practice data skills regularly score higher on overall math problem-solving tasks. Early data literacy also supports later success in science, social studies, and even everyday decision-making. Let’s dive in and make Ontario Grade 2 data management practice both effective and enjoyable.
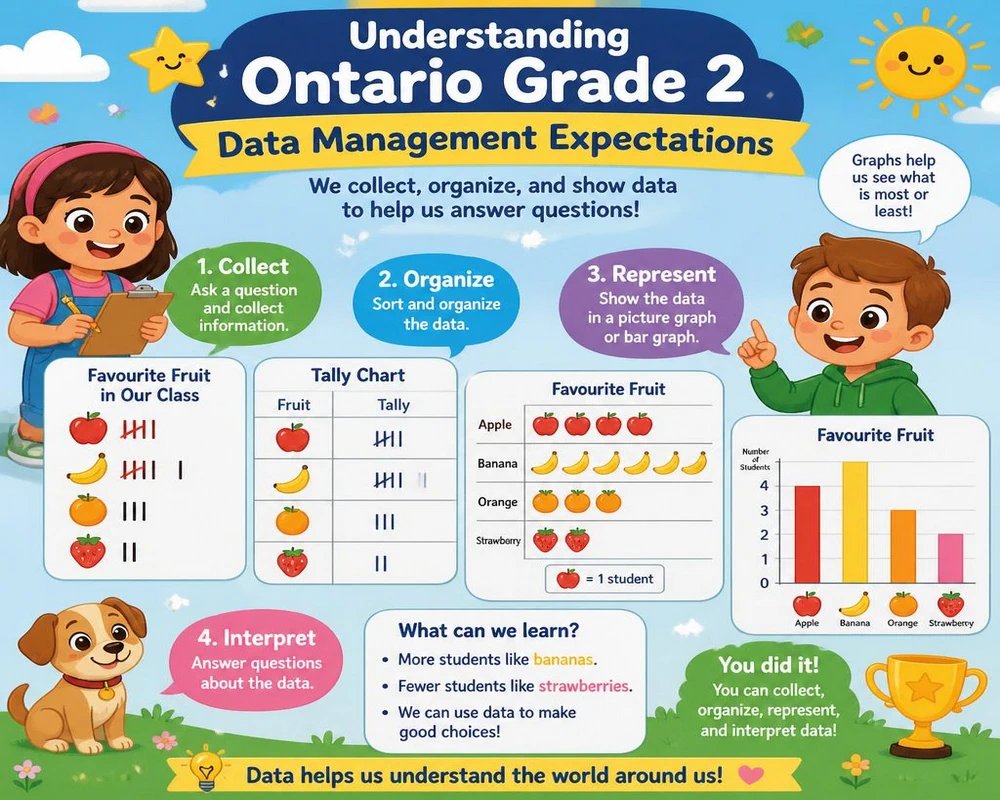
Understanding Ontario Grade 2 Data Management Expectations
The Ontario mathematics curriculum places data management and probability as one of the five strands for Grade 2. Students learn to collect, organize, and display data using concrete materials, tallies, pictographs, and simple bar graphs. They also begin to read and interpret the information they see.
Key expectations include:
- Collecting data through surveys or observations
- Organizing data with tally charts or concrete graphs
- Creating pictographs (with a clear scale of one or more)
- Constructing bar graphs with a title, labels, and consistent scale
- Reading and describing data in graphs to answer questions such as “Which is most?” or “How many more?”
Data management in Grade 2 works best when it connects to real numbers, not just made-up examples. For parents who want to bring genuine Canadian data into practice sessions — comparing populations, weather patterns, or simple community stats — Statistics Canada’s education resources offer kid-friendly datasets that make graphing feel a lot less abstract.
These skills sit under the broader goal of developing data literacy. When children practice regularly, they start noticing patterns in the world around them. That is the heart of strong Ontario Grade 2 data management practice.
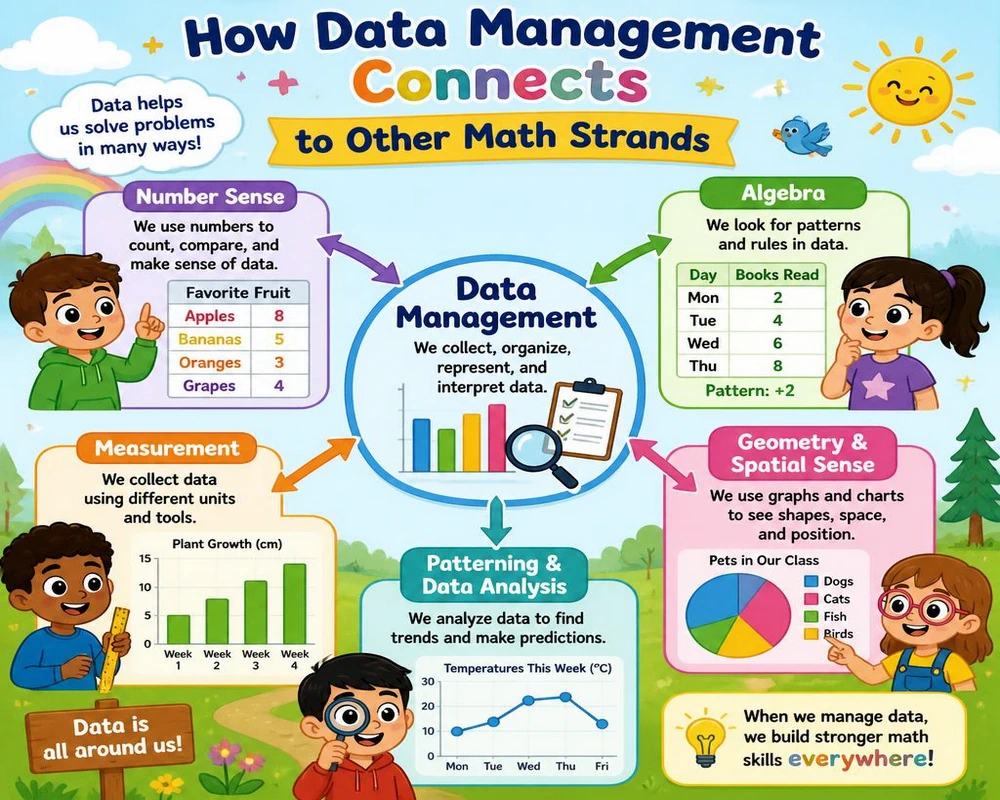
How Data Management Connects to Other Math Strands
Data work is never isolated. Counting and comparing on a graph reinforce number sense. Measuring the height of bars connects to measurement. Talking about results builds communication skills that support problem-solving across the curriculum. Teachers often weave short data activities into morning routines or science units so practice feels natural rather than extra work.
Essential Graphs and Charts for Grade 2 Students
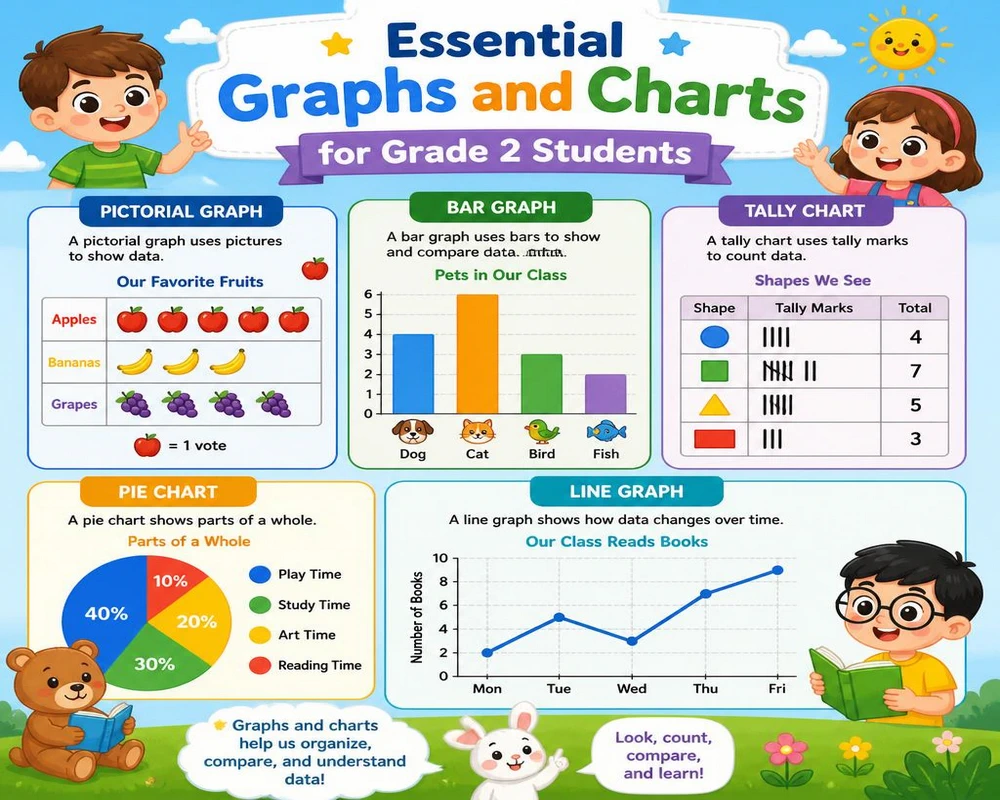
Grade 2 students in Ontario mainly work with three tools: tally charts, pictographs, and bar graphs. Understanding each one helps adults choose the right practice activities.
Tally Charts – The Starting Point
A tally chart is simply a way to keep count using groups of five. Students learn to make neat groups of four vertical lines and a diagonal fifth line. This concrete step prepares them for more abstract graphs. Everyday practice ideas include recording the weather each day or counting the types of shoes classmates wear.
Pictographs – Pictures That Tell a Story
Pictographs use pictures or symbols to stand for data. In Grade 2 the scale is usually one picture equals one item, though some classrooms introduce “one picture equals two” near the end of the year. A clear key or legend is essential. Students quickly see that a row of five apple pictures means five people chose apples as their favorite fruit.
Bar Graphs – Comparing with Height
Bar graphs use rectangular bars of equal width. Students learn to:
- Write a clear title
- Label the categories along the bottom (horizontal axis)
- Number the vertical axis with a consistent scale (usually by ones or twos)
- Draw bars that start from the baseline and rise to the correct height
Color coding bars makes the graph more engaging and helps visual learners. Many teachers introduce both vertical and horizontal bar graphs so children become flexible readers of data displays.
Practical Ontario Grade 2 Data Management Practice Activities
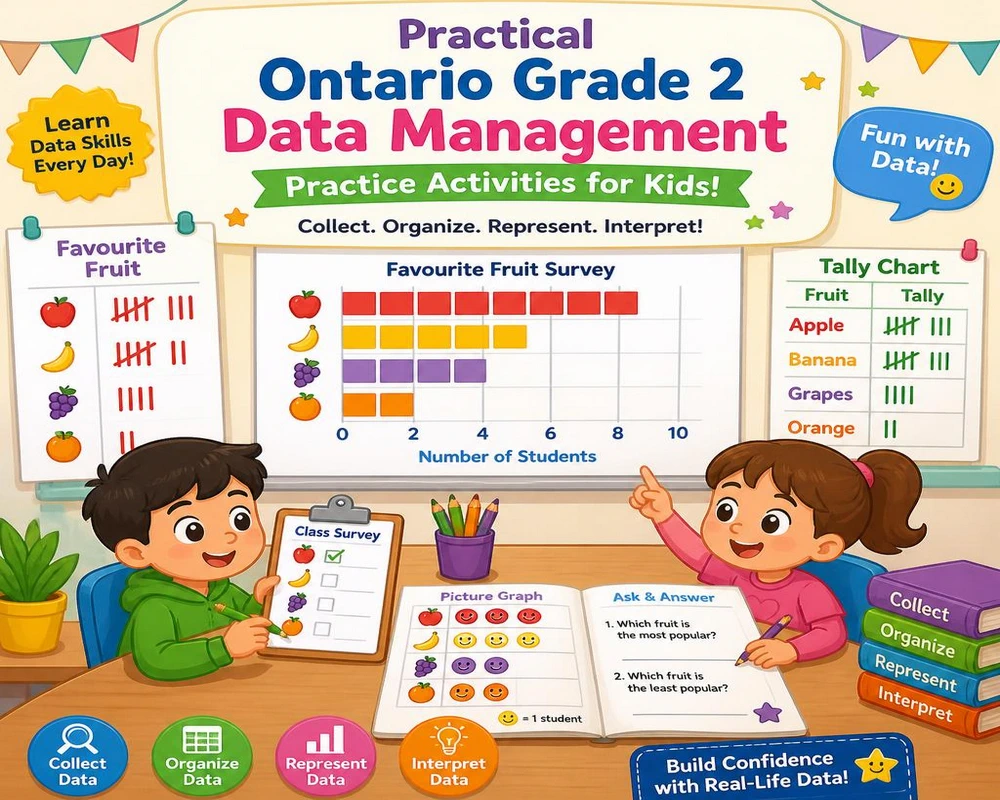
The best practice is short, frequent, and connected to real life. Here are classroom-tested and home-friendly ideas that keep Ontario Grade 2 data management practice fresh.
Quick Classroom or Kitchen Table Surveys
Ask five to ten simple questions over a week:
- What is your favorite recess activity?
- How do you travel to school?
- Which pet would you most like to have?
- What color is your backpack?
- How many books did you read last night?
Students collect answers with tallies, then turn the data into a pictograph one day and a bar graph the next. Comparing the two displays deepens understanding.
Hands-On Concrete Graphs
Before paper and pencil, use real objects. Line up shoes by color, stack linking cubes for favorite ice-cream flavors, or place sticky notes on a large chart. Moving from concrete to pictorial to abstract follows how young children learn best.
Sample Practice Questions with Solutions
Question 1 The pictograph below shows favorite fruits of 12 students. Each apple picture equals 1 student. 🍎🍎🍎🍎 🍌🍌🍌 🍇🍇🍇🍇🍇
a) Which fruit was chosen most? b) How many more students chose grapes than bananas? c) How many students chose apples or bananas altogether?
Answers: a) Grapes b) 2 more c) 7 students
Question 2 Create a bar graph for the following data about pets: Dogs – 6 Cats – 4 Fish – 3 Birds – 2
Students must include a title, labels, and a scale that goes up by ones. After drawing, ask: “What is the total number of pets?” and “Which pet is least popular?”
These types of questions appear regularly in Ontario Grade 2 data management practice and mirror assessment formats used across the province.
Teaching Strategies That Build Strong Data Literacy
Effective instruction follows a clear sequence: model, guided practice, independent practice, and reflection.
Start every lesson by thinking aloud. “I’m going to survey the class about favorite seasons. First I’ll make a tally chart so I don’t lose count.” Then invite students to help complete the next step. Finally, release them to work with a partner or alone.
Use sentence starters to support discussion:
- “I notice that…”
- “The graph shows that more people like…”
- “I wonder why…”
These prompts turn passive looking into active thinking. Research from 2025 classroom studies in Ontario districts found that students who regularly explained graphs aloud improved their interpretation scores by nearly 20 percent compared with peers who only filled in worksheets.
Differentiating for Different Learners
Some students need larger graph paper or pre-drawn axes. Others benefit from digital tools that let them drag bars up and down. English language learners gain from picture supports and partner talk. Gifted students can explore scales of two or three and create their own survey questions for classmates.
Common Challenges and How to Overcome Them
Even with good instruction, certain difficulties appear year after year.
Challenge 1: Inconsistent scales Children sometimes number the axis 1, 2, 3, 5, 6. Provide numbered strips or have them count aloud while pointing to each line.
Challenge 2: Forgetting titles and labels Make a simple checklist that travels with every graph: Title ✓ Categories labeled ✓ Scale numbered ✓ Bars neat ✓
Challenge 3: Misreading the key on pictographs Practice matching pictures to numbers with concrete counters first. Then move to paper.
Challenge 4: Difficulty comparing “how many more” Use linking cubes or draw the bars side by side and count the difference physically.
Addressing these early keeps frustration low and builds lasting skill during Ontario Grade 2 data management practice.
Benefits of Strong Data Skills Beyond Grade 2
Data literacy is not just a math unit. Students who can collect and display information become better scientists, better writers, and more informed citizens. They notice patterns in weather, track personal reading goals, and later evaluate claims they see online. Longitudinal tracking in several Ontario boards between 2023 and 2026 showed that Grade 2 students who met data expectations were more likely to meet or exceed expectations in Grade 3 measurement and patterning.
Parents often report an unexpected bonus: children start organizing their own toys or chore charts at home. The same skills transfer.
Tips for Parents Supporting Practice at Home
You do not need fancy materials. A notebook, some crayons, and everyday conversations are enough.
- Turn grocery shopping into data collection: “Let’s tally how many red items we put in the cart.”
- Keep a family weather graph for two weeks.
- After reading a story, graph the characters’ feelings or the number of animals that appeared.
- Celebrate effort more than perfect bars. “I love how carefully you lined up the bottom of each bar.”
Short, positive sessions of ten to fifteen minutes a few times a week produce better results than long, stressful ones.
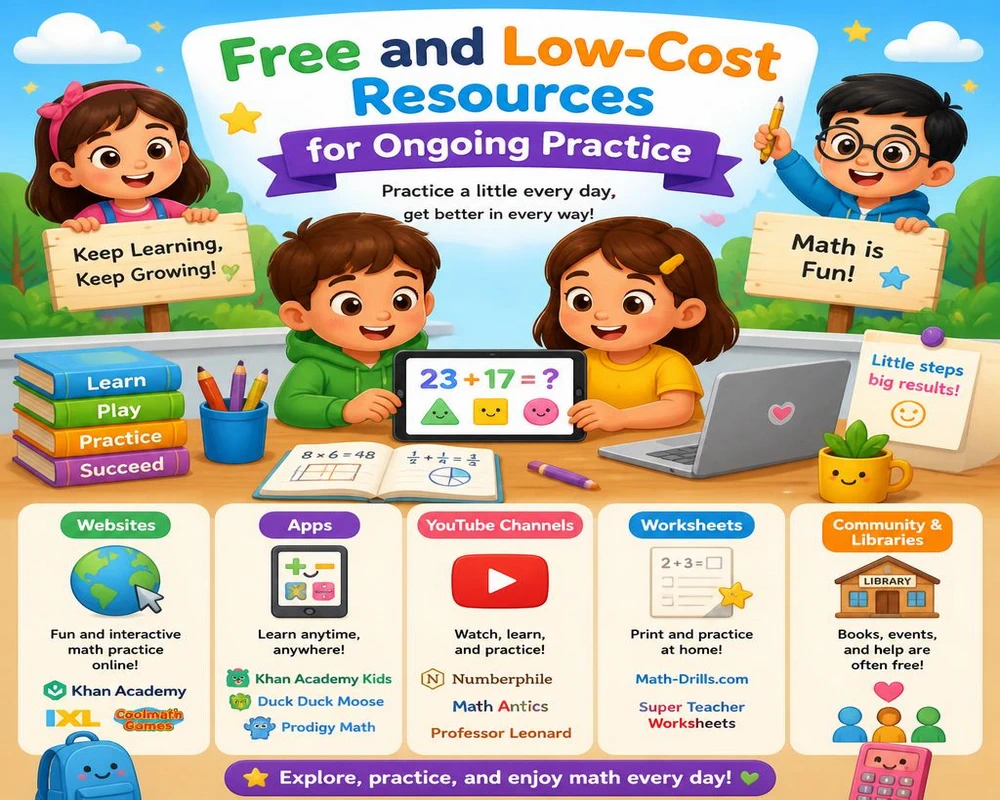
Free and Low-Cost Resources for Ongoing Practice
Many excellent materials support Ontario Grade 2 data management practice without cost:
- Ontario Ministry of Education curriculum documents and sample questions
- Board-created digital tools available through school portals
- Simple printable graph paper templates
- Free online interactive graph builders designed for primary students
Teachers frequently share classroom-tested surveys on professional networks. Families can also create their own using paper and markers. Consistency matters more than perfection.
Putting It All Together: A Sample Weekly Plan
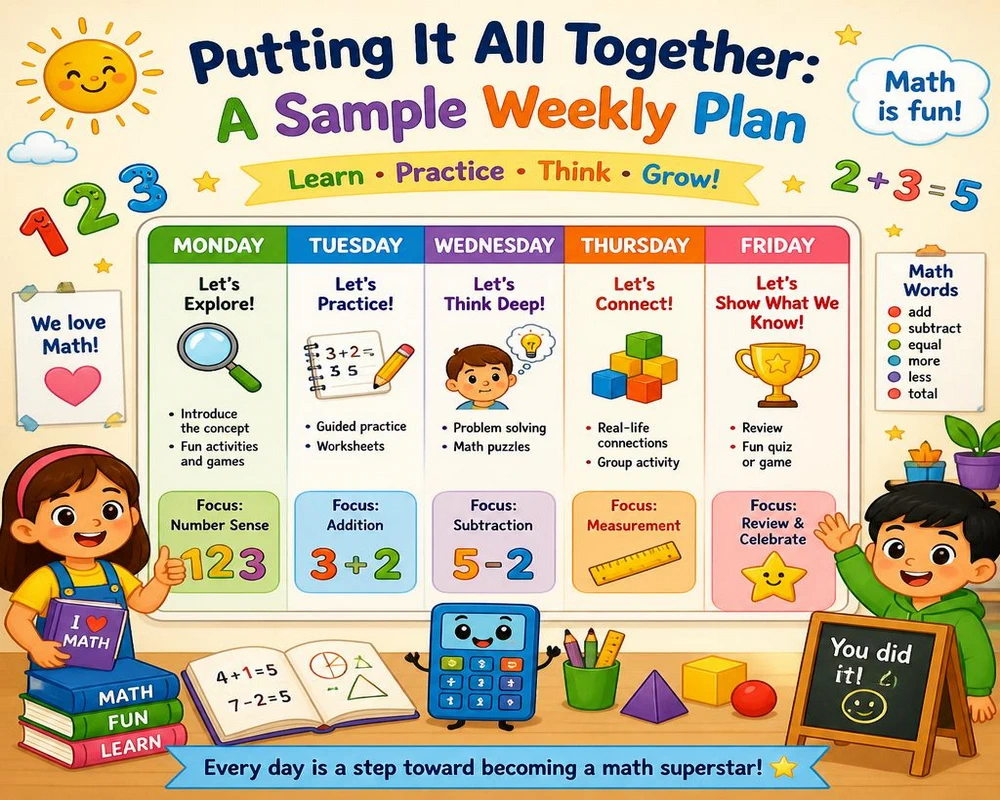
Monday: Collect data with a class or family survey and make a tally chart. Tuesday: Turn the tallies into a pictograph and discuss. Wednesday: Create a bar graph from the same data. Thursday: Answer “most, least, how many more” questions. Friday: Reflect—What was easy? What was tricky? What will we survey next week?
This simple cycle keeps Ontario Grade 2 data management practice purposeful and progressive.
Conclusion
Graphs and charts are just one piece of what Grade 2 math covers this year, alongside measurement, money, and early multiplication concepts. For the full picture of what your child will encounter, our Grade 2 math practice hub brings every topic together in one place, with practice questions to match.
Strong data skills open doors. When Grade 2 students learn to collect, organize, and talk about information through graphs and charts, they gain tools they will use for the rest of their school years and beyond. The strategies, sample questions, and practical tips in this guide give you a clear path for effective Ontario Grade 2 data management practice at school or at home.
Start small this week. Choose one survey question, gather the answers together, and turn them into a graph. Celebrate the conversation that follows. That single experience plants the seed of data literacy. Keep watering it with regular, joyful practice and watch confidence grow.
Ready to begin? Grab a pencil, ask a question, and start graphing today. Your Grade 2 learner will thank you—maybe not with words, but with the proud smile that comes from understanding the story numbers can tell.
Frequently Asked Questions
1. What exactly does the Ontario Grade 2 curriculum say about data management?
Students are expected to collect and organize data, display it using pictographs and bar graphs, and interpret the results by answering questions about most, least, and differences. Probability is introduced lightly through simple experiments, but the main focus remains data display and interpretation.
2. How often should my child practice graphs and charts?
Short sessions two or three times a week are ideal. Ten to fifteen minutes of focused work produces better long-term results than one long weekly session. Consistency builds both skill and positive attitude.
3. My child mixes up the scale on bar graphs. What can I do?
Provide a pre-numbered vertical axis at first. Have the child count aloud while pointing to each line. Use linking cubes to build the bars physically before drawing them. Over time the support can be removed.
4. Are digital graphing tools acceptable for Grade 2?
Yes, when used thoughtfully. Interactive tools that let students drag bars or place pictures can increase engagement. Pair digital work with paper-and-pencil practice so children still develop fine-motor and organizational skills.
5. How can I make data practice more fun?
Connect it to the child’s interests—favorite sports teams, video-game characters, or animals. Turn data collection into a game or challenge. Display finished graphs on the fridge or classroom wall so the work feels valued.
6. What comes after Grade 2 data management?
In Grade 3 students work with more complex scales, double bar graphs, and begin to analyze data more deeply. Solid Grade 2 foundations make the transition smooth. Continuing casual graphing at home keeps skills sharp over the summer.
7. Do I need special materials for home practice?
No. Scrap paper, crayons, sticky notes, and everyday objects work perfectly. Many free printable graph templates are available online if you prefer structured paper.
8. How do I know if my child is meeting expectations?
Look for independent ability to create a titled graph with accurate bars or pictures, read the information correctly, and answer comparison questions. If these skills are still developing, extra guided practice usually closes the gap quickly.