
Ontario Report Card Math Levels Explained Simply
A report card comes home with a “C” next to math, and a parent’s first reaction is often panic — until they realize a C on an Ontario elementary report card isn’t what it looks like on report cards from other places. Ontario report card math levels explained honestly require understanding a system that’s genuinely different from a simple pass-fail or percentage scale, and once the pieces click into place, that C stops feeling like bad news.
This guide breaks down exactly what each level means, how letter grades connect to those levels, and what the less common codes (R and I) actually indicate — everything needed for Ontario report card math levels explained clearly, without the jargon.
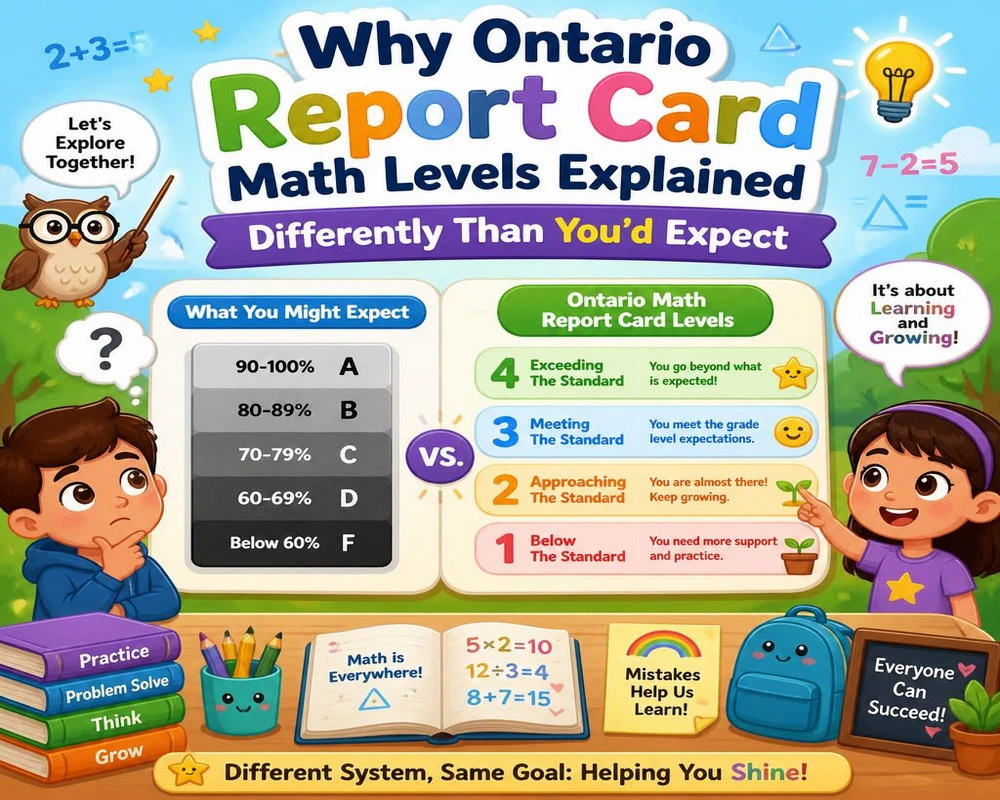
Why Ontario Report Card Math Levels Explained Differently Than You’d Expect
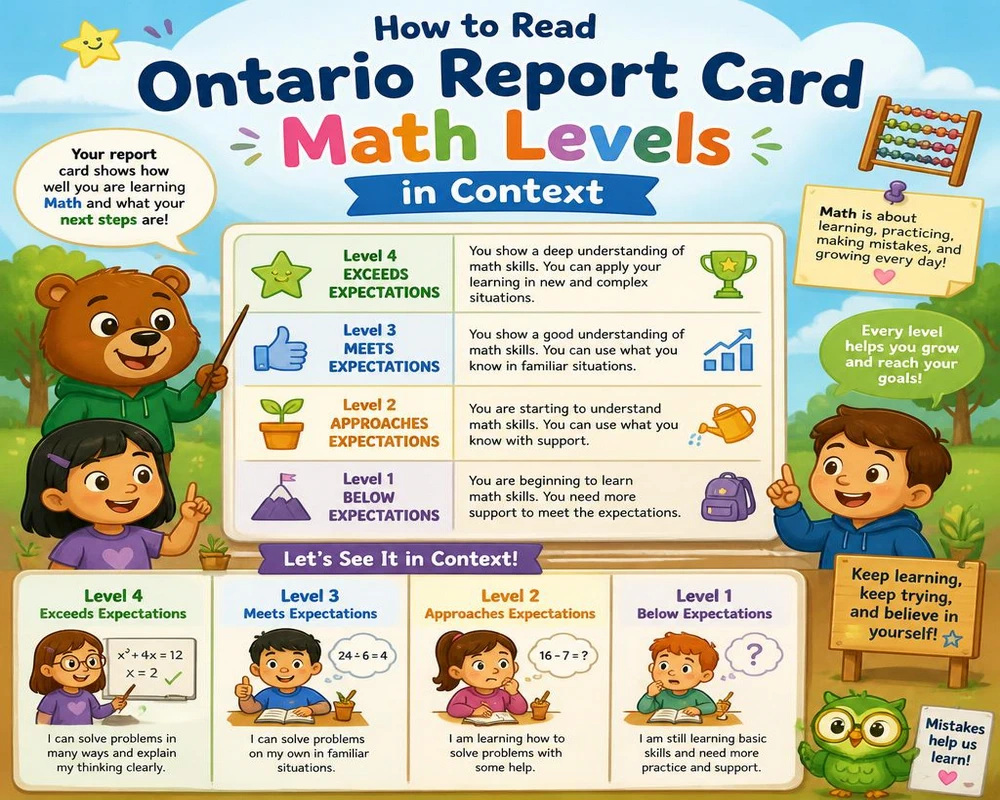
Ontario’s elementary report cards, covering Grades 1 through 6, use letter grades — A, B, C, D — rather than raw numbers, and each letter maps directly onto one of four achievement levels: A is Level 4, B is Level 3, C is Level 2, and D is Level 1. Grades 7 and 8 shift to percentage marks instead, though the same four-level framework sits underneath.
This matters because Ontario report card math levels explained through this lens reveal something important: a Level 3 isn’t a middling, “just okay” result. It’s specifically defined as meeting the provincial standard — the expected level of achievement for that grade. Level 3 is the target, not a consolation prize.
What Each Level Actually Represents
This table forms the core of Ontario report card math levels explained for any parent trying to make sense of a specific letter grade.
| Level | Letter Grade | Approximate Percentage | What It Means |
|---|---|---|---|
| Level 4 | A | 80-100% | Achievement well above the provincial standard |
| Level 3 | B | 70-79% | Achievement at the provincial standard (the target) |
| Level 2 | C | 60-69% | Achievement approaching the provincial standard |
| Level 1 | D | 50-59% | Achievement below the provincial standard |
Understanding the R and I Codes in Ontario Report Card Math Levels
What “R” Means
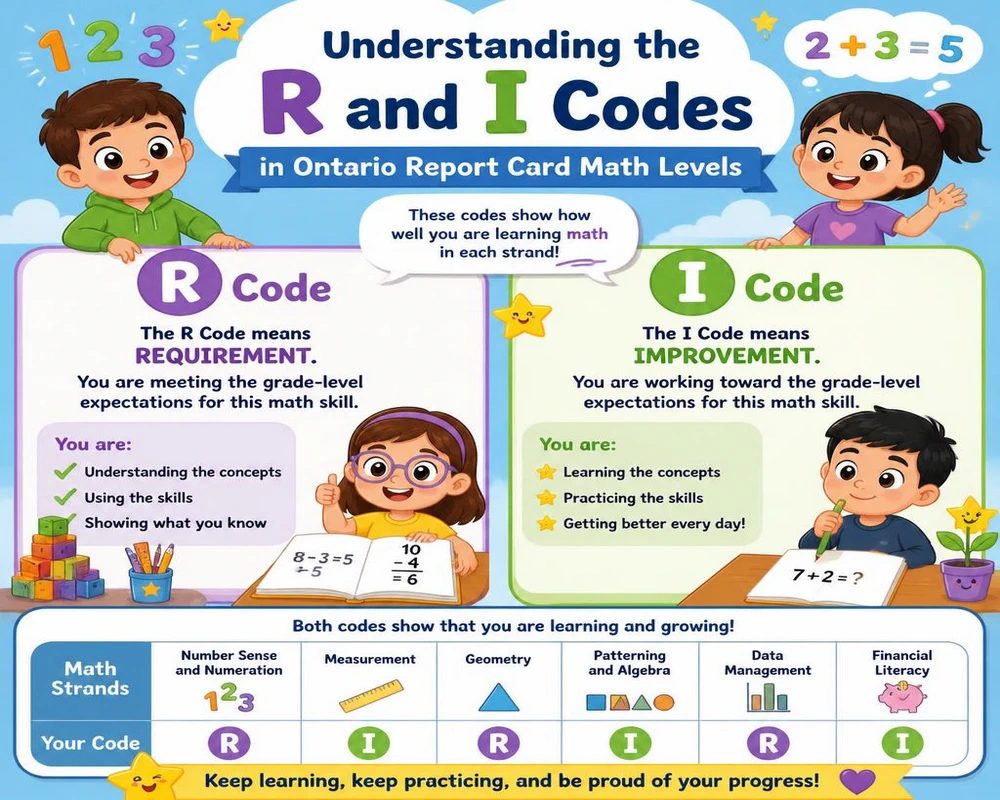
The R code appears on elementary report cards when a child has not demonstrated the required knowledge and skills for that subject, and extensive remediation is needed. It sits below Level 1 and is generally the code most worth acting on quickly within Ontario report card math levels explained here, since it points to a missing foundational skill rather than just room for improvement.
What “I” Means
The I code stands for insufficient information — it means the teacher simply didn’t have enough evidence to assign a grade, often following a recent transfer, an extended absence, or missed assessments. It isn’t a failing grade at all; it’s the absence of one, and it typically resolves once more classroom evidence is collected.
The Three Report Cards Behind Ontario Report Card Math Levels Explained
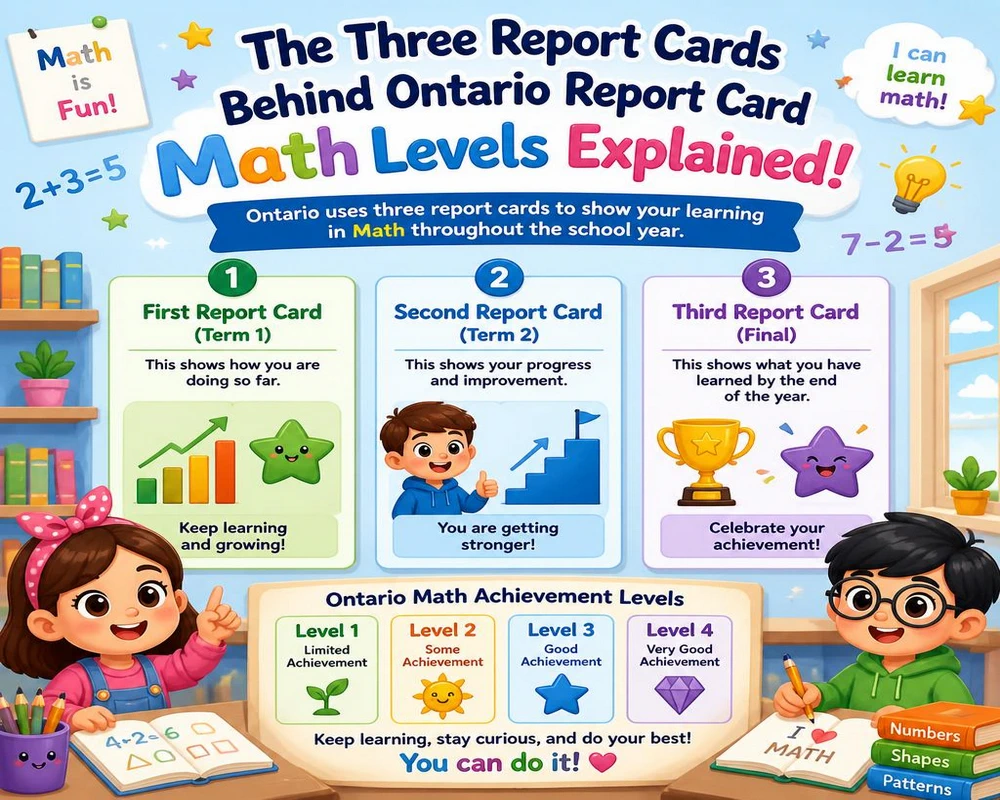
The Fall Progress Report (October-November)
This early checkpoint doesn’t use letter grades or levels at all. Instead, it describes whether a child is progressing “very well,” “well,” or “with difficulty” in each subject. It’s meant as an early read on how the year is starting, not a formal evaluation.
The First Provincial Report Card (January-February)
This is the first report card to include actual letter grades and, therefore, the first place Ontario report card math levels explained above actually appear in writing.
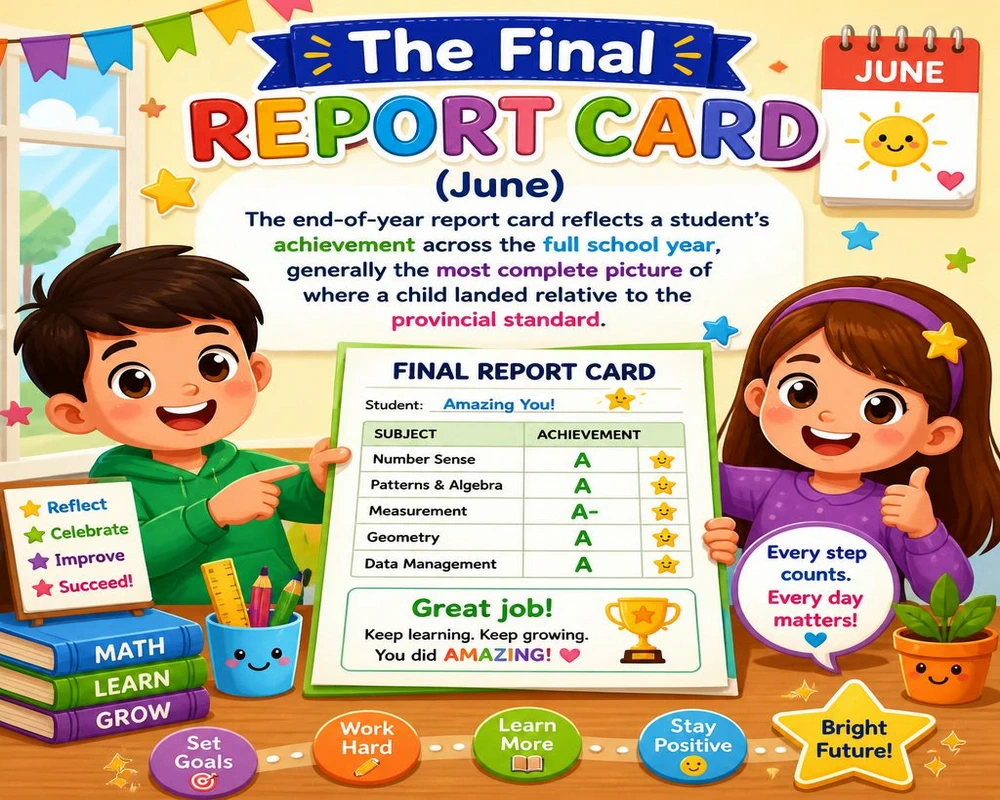
The Final Report Card (June)
The end-of-year report card reflects a student’s achievement across the full school year, generally the most complete picture of where a child landed relative to the provincial standard.
How to Read Ontario Report Card Math Levels in Context
A Single Level Is a Snapshot, Not a Verdict
A Level 2 in the winter report card doesn’t predict a Level 2 in June. Ontario’s report cards are built around ongoing growth, and a level reflects performance up to that specific reporting period, not a fixed judgment on a child’s ability.
Levels Apply Per Subject, Not Overall
A child might sit at Level 4 in reading and Level 2 in math on the same report card. This is completely normal and simply reflects genuinely different skill development across subjects, not an inconsistency worth worrying about.
Teacher Comments Matter as Much as the Letter
The letter grade alone doesn’t explain why a child landed at that level. Reading the accompanying comments carefully often reveals specific, actionable next steps that Ontario report card math levels explained by the letter alone simply can’t communicate.
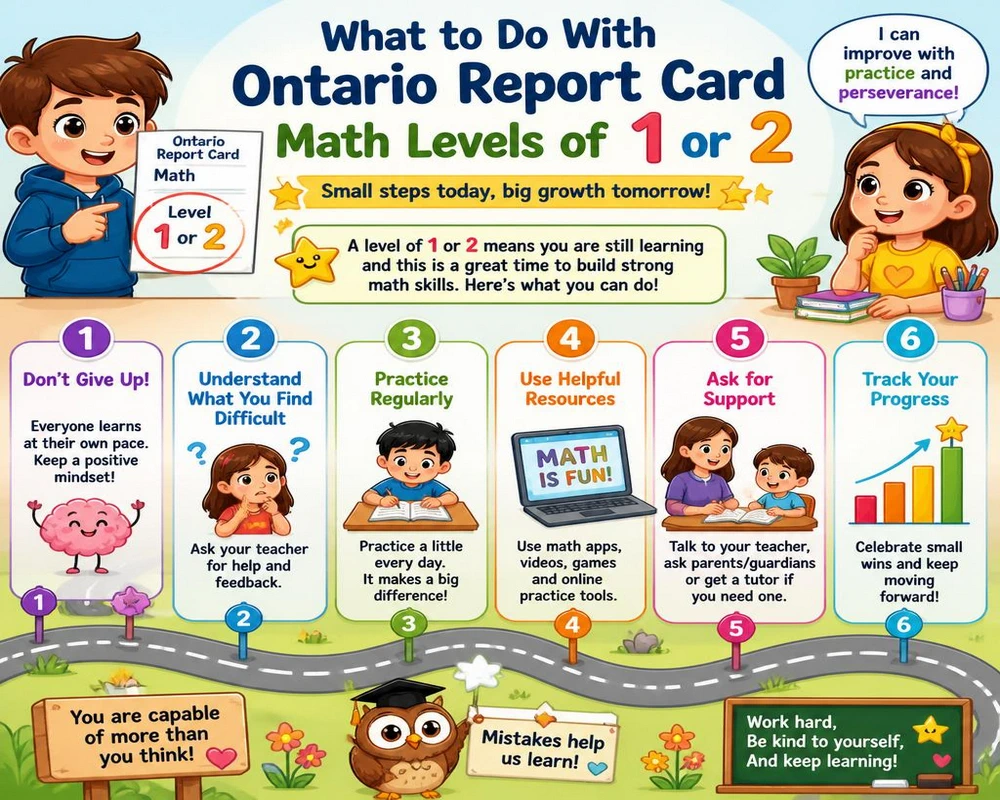
What to Do With Ontario Report Card Math Levels of 1 or 2
Request Specifics From the Teacher
Ask which specific strand or expectation is driving the lower level — Number, Algebra, Data, Spatial Sense, or Financial Literacy — rather than assuming the entire subject needs equal attention.
Focus Practice on the Identified Gap
Once the specific strand is known, targeted practice in that exact area tends to move a level far faster than generalized “more math” review across everything — a strategy that only works once Ontario report card math levels explained by strand, not just overall subject, actually get read carefully.
Revisit After the Next Reporting Period
Since levels are recalculated each term, consistent, focused practice between report cards genuinely can shift a level by the next one, especially when paired with direct communication with the teacher.
Common Misunderstandings About Ontario Report Card Math Levels
Three misconceptions come up constantly once parents start trying to make sense of Ontario report card math levels explained in a report card summary rather than a full conversation with the teacher.
Assuming Level 3 Is Mediocre
Because “3 out of 4” sounds like a B-minus mentality in some other systems, parents sometimes assume Level 3 signals a problem. In Ontario’s framework, Level 3 is specifically the provincial target — genuinely good news, not a concern.
Comparing Levels Across Different Grades Directly
A Level 3 in Grade 2 and a Level 3 in Grade 5 reflect meeting very different sets of expectations, since the curriculum content itself changes significantly each year. This is exactly why Ontario report card math levels explained in isolation, without grade context, can mislead parents comparing siblings or years. A consistent Level 3 across grades actually reflects steady, appropriate growth, not stagnation.
Treating the R Code as Just a Low Grade
R sits in a different category entirely from Level 1 — a distinction that gets lost when Ontario report card math levels explained casually get lumped together with the R and I codes. R specifically signals that required knowledge hasn’t yet been demonstrated, which usually calls for a direct conversation with the teacher rather than just more general practice.
Frequently Asked Questions About Ontario Report Card Math Levels Explained
1. What is considered a good level on an Ontario report card?
Within Ontario report card math levels explained by the province, Level 3 is the provincial standard and the general target for grade-appropriate achievement, while Level 4 represents achievement above that standard.
2. How do letter grades relate to achievement levels in Grades 1-6?
A corresponds to Level 4, B to Level 3, C to Level 2, and D to Level 1 — the exact mapping at the heart of Ontario report card math levels explained for elementary families.
3. What does the R code mean on a report card?
R indicates a child has not demonstrated the required knowledge and skills for a subject and needs extensive remediation, sitting below Level 1 on the achievement scale.
4. Does the fall progress report use levels or letter grades?
No, the fall progress report uses descriptive terms like “progressing very well,” “well,” or “with difficulty” rather than formal levels or letter grades.
5. Can a child’s level change between report cards?
Yes, levels reflect achievement up to that specific reporting period, and consistent, targeted practice between report cards can genuinely shift a level by the next one.
6. Should I be worried if my child gets different levels in different subjects?
Not necessarily. Ontario report card math levels explained per subject, not overall, so it’s common for a child to show different levels of achievement across reading, writing, and math, reflecting genuinely different skill development in each area.
7. What should I do if my child receives a Level 1 in math?
Ask the teacher which specific strand is driving the lower level, then focus home practice on that exact area rather than reviewing all of math equally.
Understanding Ontario report card math levels explained here is just the first step — building the actual math skills behind them matters more. Our Ontario math practice platform covers every grade and strand, helping target practice exactly where a report card indicates it’s needed.
For the complete, official policy behind Ontario’s report cards, the Ontario Ministry of Education’s assessment and reporting page outlines the full Growing Success framework these levels are based on.