
Grade 6 Data Management Practice: The Simple Slice Method
A circle graph looks deceptively simple — just a circle cut into a few coloured slices — but behind every slice sits a genuine calculation most students never see happen. Grade 6 data management practice introduces circle graphs specifically because they connect percentages, degrees, and real data in one visual, and understanding how a slice’s size gets calculated turns a graph from a picture into actual information.
This guide follows one real survey from raw votes through percentages, degree calculations, and a finished circle graph, then extends this Grade 6 data management practice into median, mode, and comparing data sets.
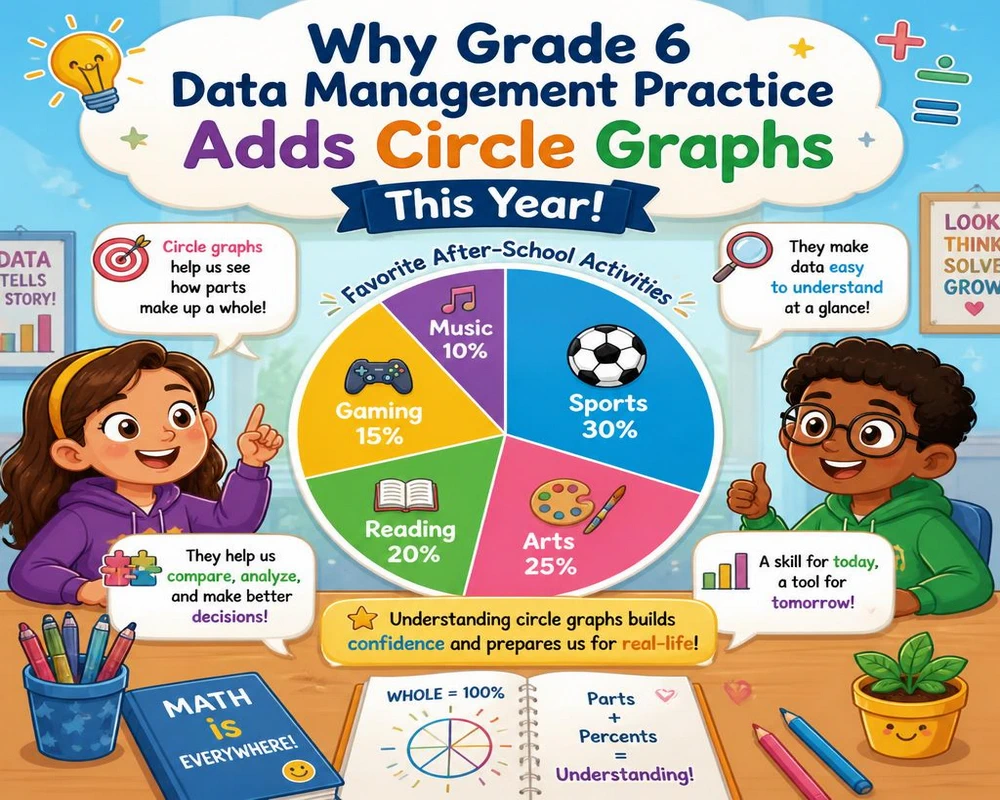
Why Grade 6 Data Management Practice Adds Circle Graphs This Year
Ontario’s curriculum introduces circle graphs formally in Grade 6, building on the bar graphs and mean, median, and mode work from earlier grades. A circle graph asks students to connect three ideas at once: the percentage each category represents, the degree measurement of its slice, and the visual proportion on the page — which is exactly what sets this year’s Grade 6 data management practice apart from earlier grades.
This matters because Grade 6 data management practice with circle graphs only makes real sense once a student sees how a percentage becomes an actual angle. A full circle is 360 degrees, and each slice’s angle is simply that percentage of 360.
What the Ontario Curriculum Expects in Grade 6
By the end of Grade 6, students are generally expected to master the following pieces of Grade 6 data management practice:
- Construct and interpret circle graphs
- Convert data into percentages and corresponding degree measurements
- Calculate the median and mode of a data set
- Compare different graph types and choose an appropriate one for given data
- Draw conclusions and make predictions based on displayed data
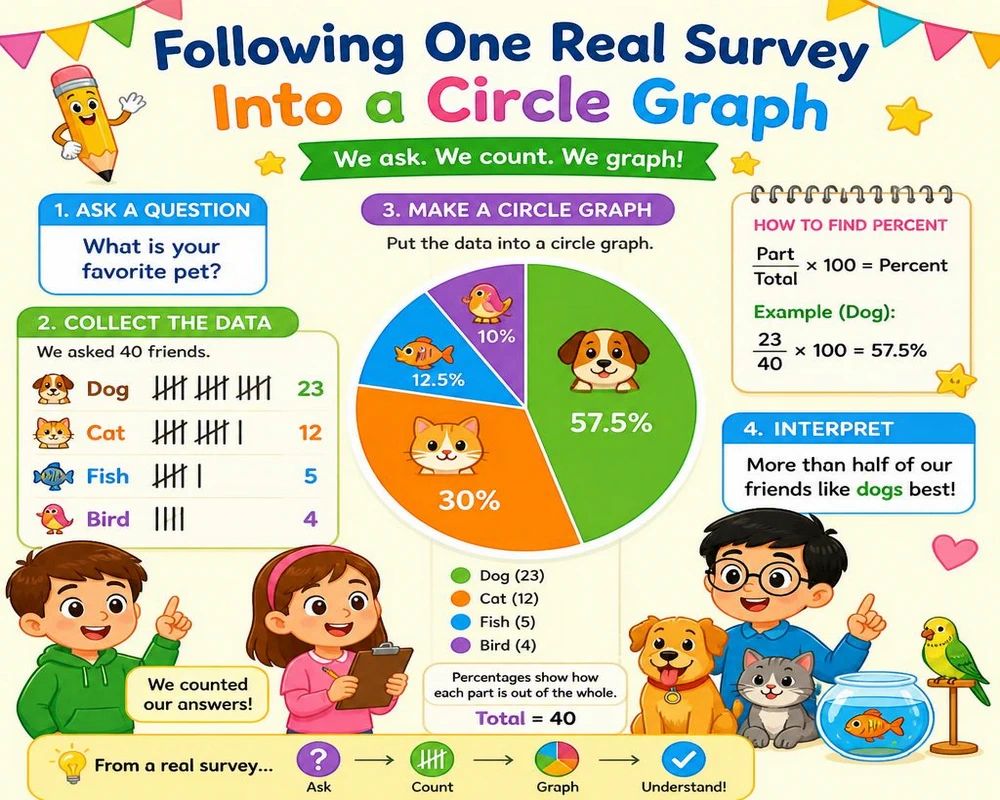
Following One Real Survey Into a Circle Graph
The Survey: Favourite Sport
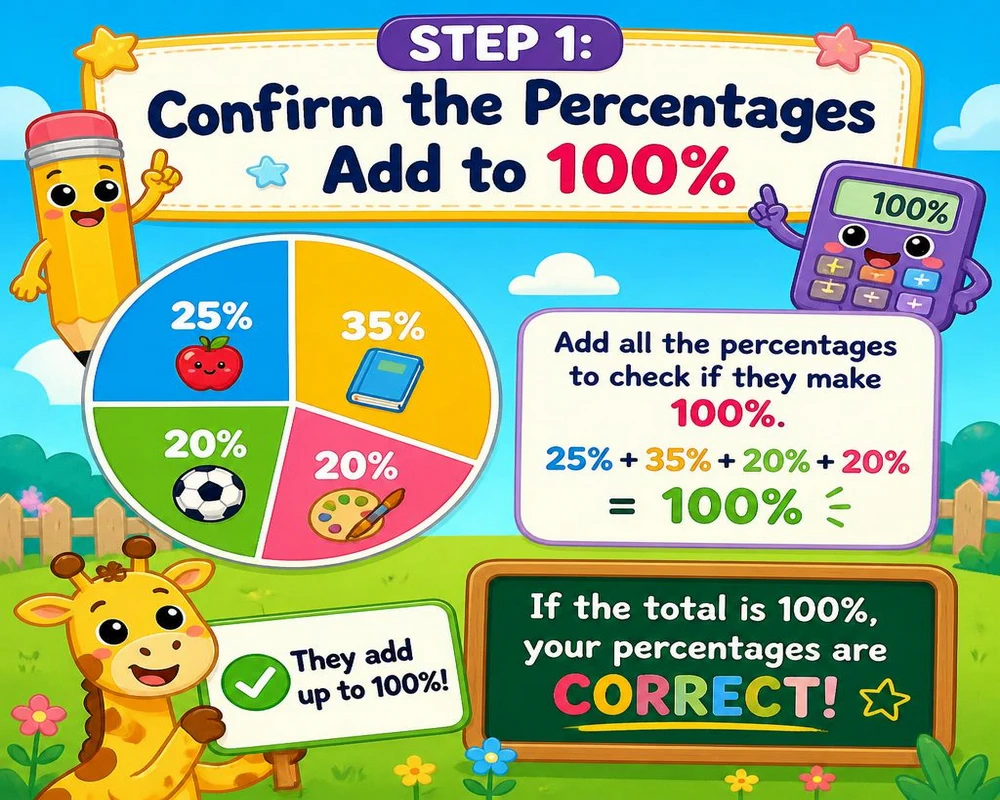
A class of students was asked to name their favourite sport. The results: 35% chose soccer, 25% chose basketball, 20% chose swimming, and 20% chose something else.
Step 1: Confirm the Percentages Add to 100%
35 + 25 + 20 + 20 = 100%. This check should always come first, since a circle graph representing anything other than a complete 100% doesn’t make sense.
Step 2: Convert Each Percentage to Degrees
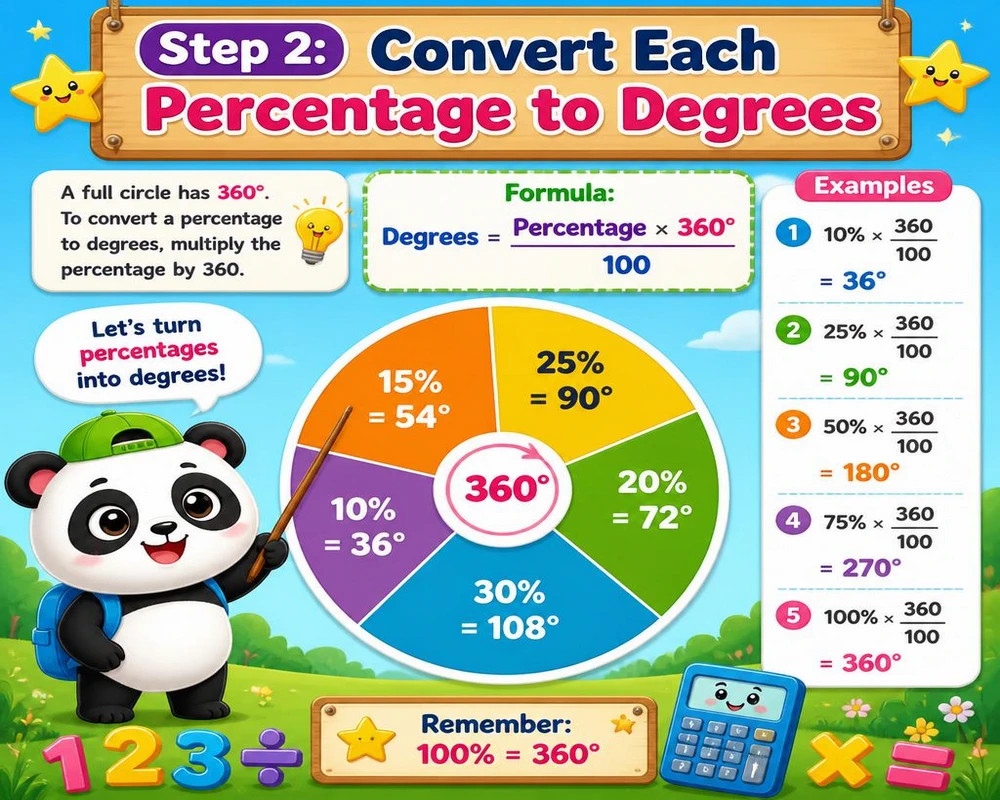
Since a full circle is 360 degrees, each percentage becomes a fraction of 360.
| Category | Percentage | Degree Calculation | Degrees |
|---|---|---|---|
| Soccer | 35% | 35% × 360 | 126° |
| Basketball | 25% | 25% × 360 | 90° |
| Swimming | 20% | 20% × 360 | 72° |
| Other | 20% | 20% × 360 | 72° |
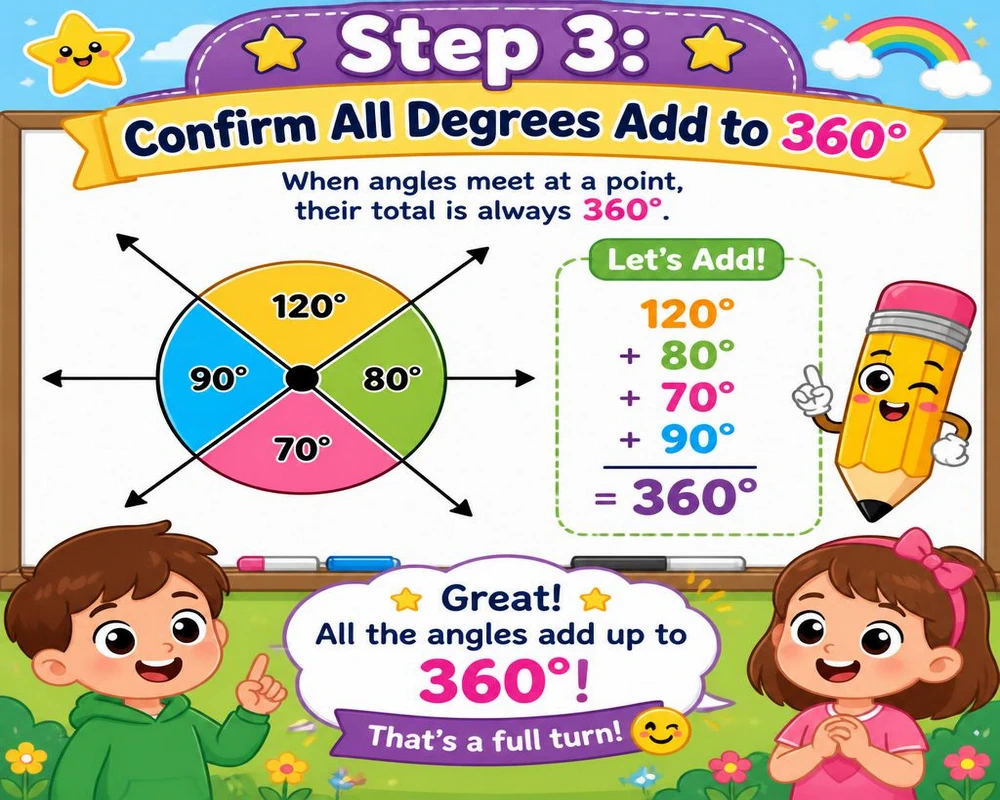
Step 3: Confirm All Degrees Add to 360
126 + 90 + 72 + 72 = 360 degrees, confirming the circle graph accounts for the entire data set with no gaps or overlaps.
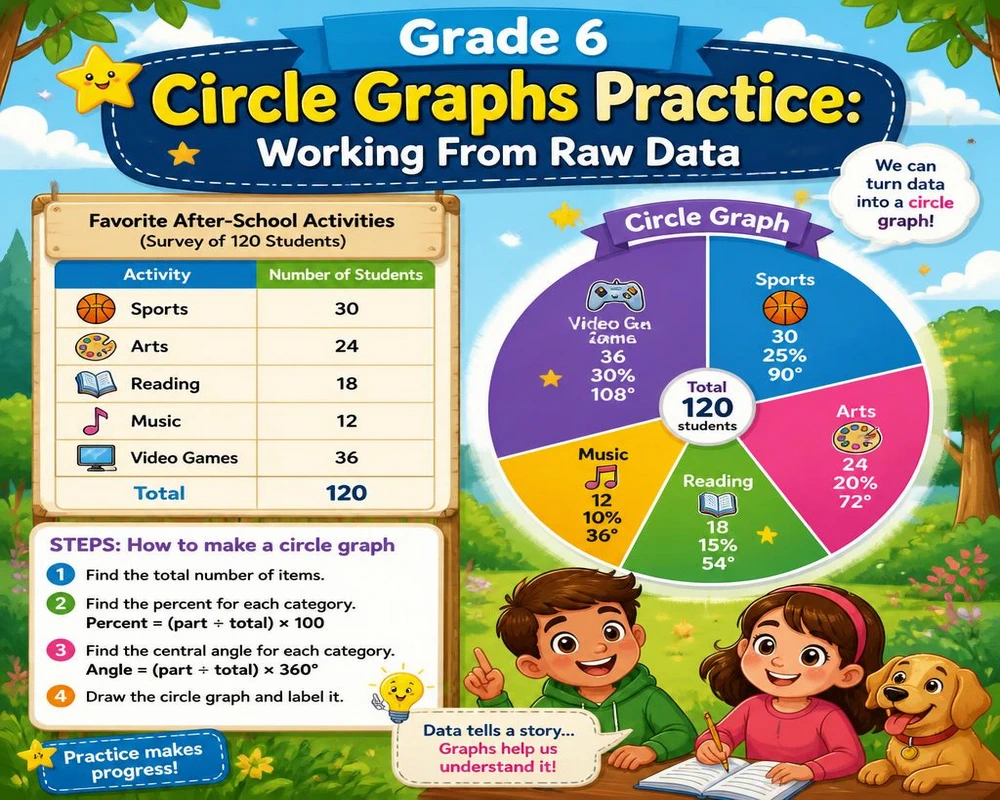
Grade 6 Circle Graphs Practice: Working From Raw Data
Real Grade 6 data management practice often starts with raw counts, not percentages already calculated — which means an extra step comes first.
Worked Example
Here’s a full Grade 6 data management practice example: a survey of 25 students about favourite colour produced these raw votes: red 12, blue 8, green 5.
Step 1 (convert to percentage): Red: 12 ÷ 25 = 48%. Blue: 8 ÷ 25 = 32%. Green: 5 ÷ 25 = 20%.
Step 2 (convert to degrees): Red: 48% × 360 = 172.8°. Blue: 32% × 360 = 115.2°. Green: 20% × 360 = 72°.
Practice Questions
- A survey of 40 students shows 20 prefer pizza. What percentage and degree measurement does this represent?
- If one category takes up 90 degrees of a circle graph, what percentage of the data does it represent?
Answers: 1) 50%, which is 180 degrees 2) 25% (since 90 is one-quarter of 360)
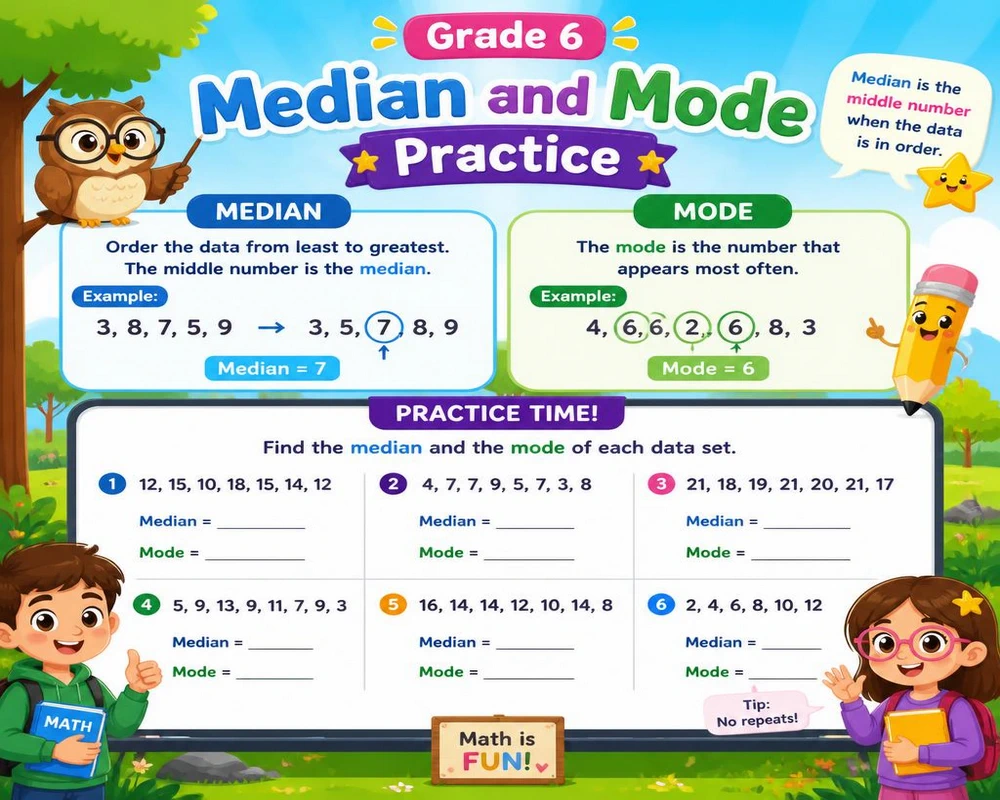
Grade 6 Median and Mode Practice
Alongside circle graphs, Grade 6 data management practice deepens median and mode work with larger, more varied data sets.
Worked Example
A data set of test scores: 72, 85, 91, 85, 78, 85, 90.
Ordering the data: 72, 78, 85, 85, 85, 90, 91
Median (middle value): 85
Mode (most frequent value): 85 (appears three times)
Practice Questions
- Find the median of this data set: 15, 22, 18, 30, 25.
- Find the mode of this data set: 6, 9, 6, 12, 6, 9.
Answers: 1) 22 (ordered: 15, 18, 22, 25, 30) 2) 6 (appears three times)
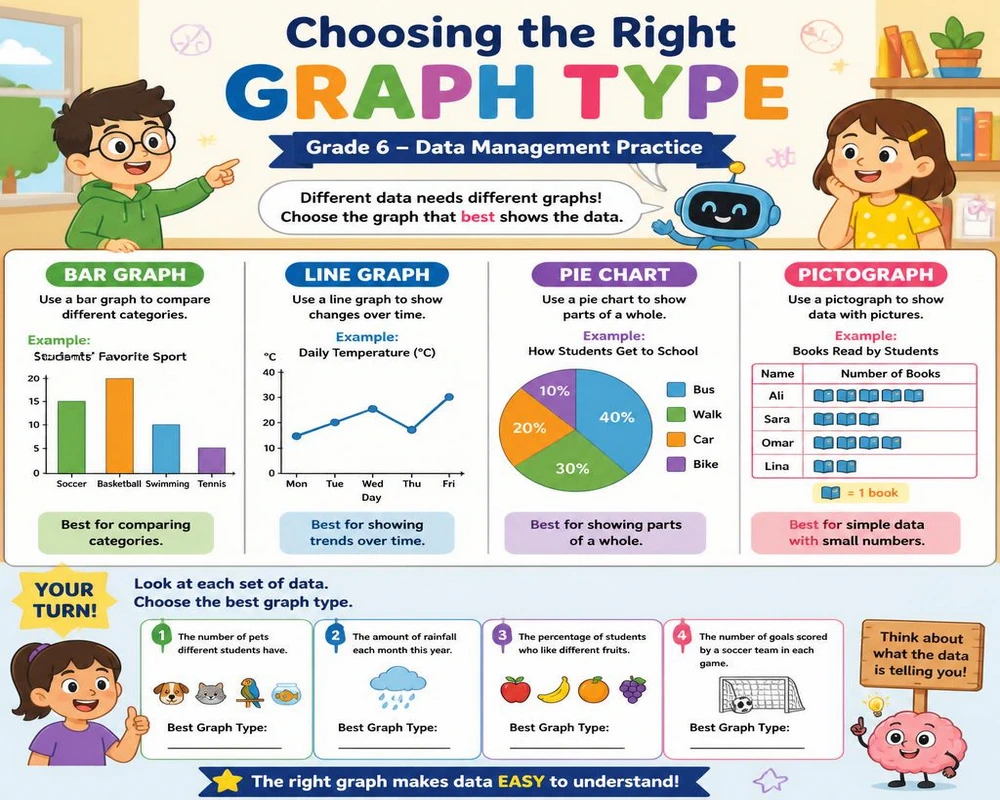
Choosing the Right Graph Type: Grade 6 Data Management Practice
Part of genuine Grade 6 data management practice involves recognizing which graph fits which situation, not just building whichever type was assigned.
| Situation | Best Graph Type |
|---|---|
| Comparing category totals side by side | Bar graph |
| Showing parts of a whole as percentages | Circle graph |
| Tracking change over time | Line graph |
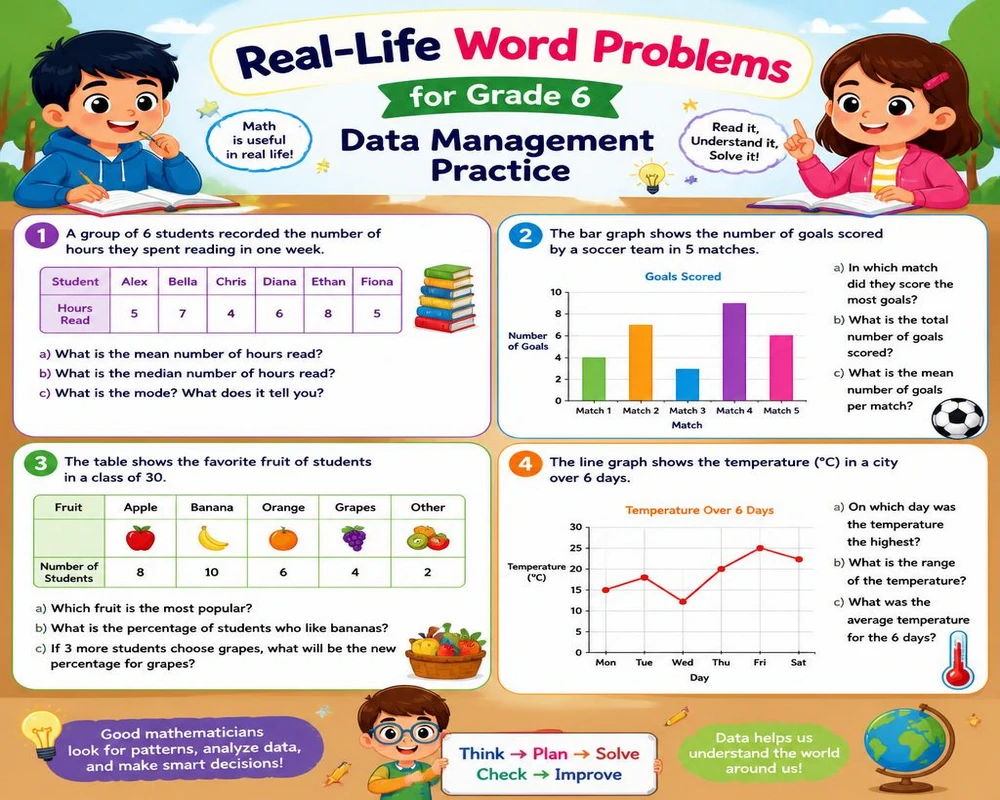
Real-Life Word Problems for Grade 6 Data Management Practice
- A survey of 50 people about favourite season shows 15 chose summer. What percentage and degree measurement does this represent on a circle graph?
- A data set of daily temperatures: 18, 22, 19, 25, 18, 20. What is the mode?
- A circle graph shows 40% of a school’s students walk to school. How many degrees does this slice take up?
Answers: 1) 30%, which is 108 degrees 2) 18 (appears twice) 3) 144 degrees
Common Mistakes in Grade 6 Data Management Practice
Three specific errors account for most of the wrong answers seen in Grade 6 data management practice involving circle graphs and central tendency.
Forgetting to Check That Percentages Total 100%
Skipping this check means an error elsewhere in the data can go unnoticed until the circle graph visibly doesn’t add up. Making this the very first step prevents wasted work later.
Confusing Median With Mean
Since both involve a single “typical” value, students sometimes calculate the average instead of finding the middle value once data is ordered. Reinforcing “order first, then find the middle” as a fixed habit prevents this mix-up.
Skipping the Percentage Step Before Finding Degrees
Some students try to convert raw counts directly into degrees without calculating percentage first, producing an incorrect angle. The two-step process — percentage, then degrees — should always happen in that order.
Frequently Asked Questions
1. How do you find the degree measurement for a circle graph slice?
This calculation sits at the center of Grade 6 data management practice with circle graphs: calculate what percentage of the total the category represents, then multiply that percentage by 360, since a full circle equals 360 degrees.
2. What’s the difference between median and mode?
Median is the middle value of an ordered data set, while mode is the value that appears most frequently. A data set can have one median but multiple modes, or no mode at all.
3. Why do all the degrees in a circle graph need to add up to 360?
Because the full circle represents 100% of the data, and 360 degrees is the complete angle measurement of any circle, with no gaps or overlaps.
4. When should I use a circle graph instead of a bar graph?
Circle graphs work best when showing how parts make up a whole, like percentages of a total, while bar graphs work better for comparing separate category totals side by side.
5. How can I practice circle graphs without special software?
A protractor and a printed circle template work well for constructing graphs by hand, which builds stronger understanding than software that calculates the angles automatically.
6. How much data management practice should we do at home?
About 15-20 minutes, a few times a week, tends to work well for Grade 6 data management practice, especially when working through a real survey from raw data to a finished circle graph.
7. How does this connect to Grade 7?
Grade 7 builds on circle graphs and median and mode work with more complex data sets and deeper statistical comparisons between multiple graphs.
Data management is one part of a full Grade 6 year that also includes ratios, fractions, and probability. Circle graphs are one of the more visually rewarding parts of Grade 6 data management practice, since the finished graph makes the underlying percentages immediately obvious. Our Grade 6 math practice hub covers every topic in one place.
Real Canadian data makes graphing and statistics practice feel far less abstract. Statistics Canada’s education resources offer kid-friendly datasets that pair well with the circle graph and median work covered in this guide.