
Ontario Math Achievement by School Board: 5 Real Facts
Ontario math achievement by school board isn’t a single, simple ranking, no matter how much a quick search might suggest otherwise. EQAO publishes results for every school board separately, and the differences between them are genuinely real — but comparing boards fairly requires understanding what the numbers actually measure, not just which board scored higher this particular year.
This guide covers five real facts about how Ontario math achievement by school board actually works, plus the exact, official tool to check your own board’s current numbers rather than relying on a secondhand summary or an outdated comparison.
Fact 1: EQAO Publishes Every Board’s Results Publicly
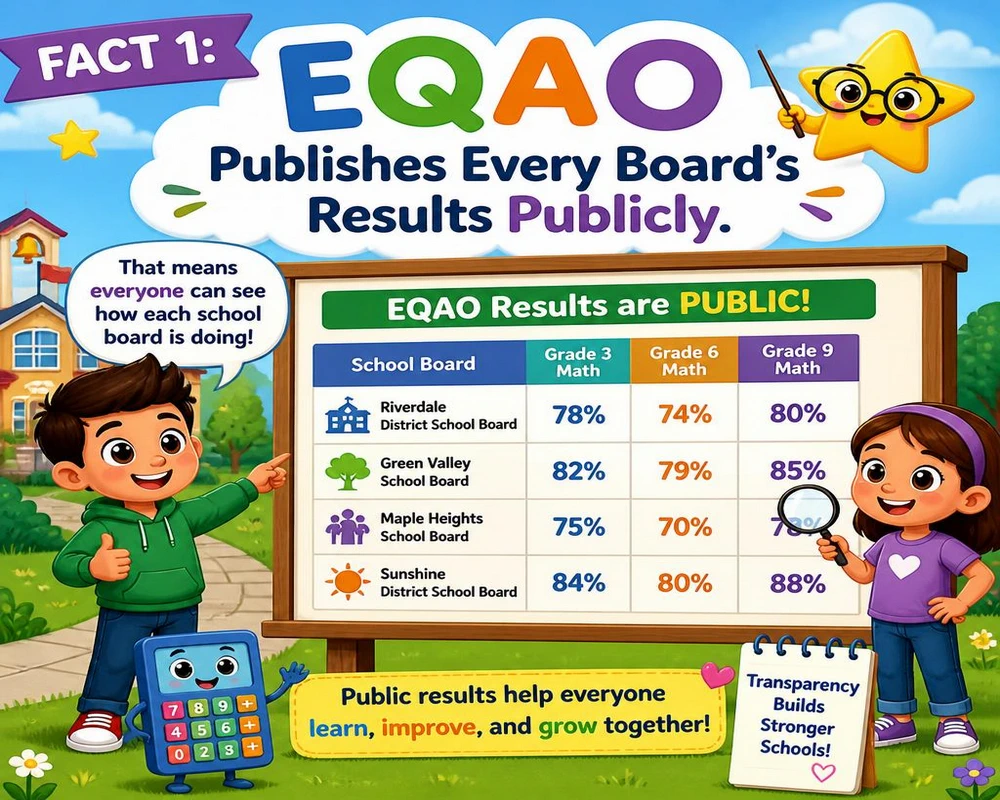
Every English and French-language school board in Ontario has its Grade 3 and Grade 6 math results published directly by EQAO, alongside provincial averages, updated annually after each spring assessment cycle. This isn’t hidden or hard-to-find data; it’s built specifically for public access, making Ontario math achievement by school board comparisons genuinely possible for any parent willing to look up the numbers directly.
Fact 2: Some Boards Genuinely Outperform the Provincial Average
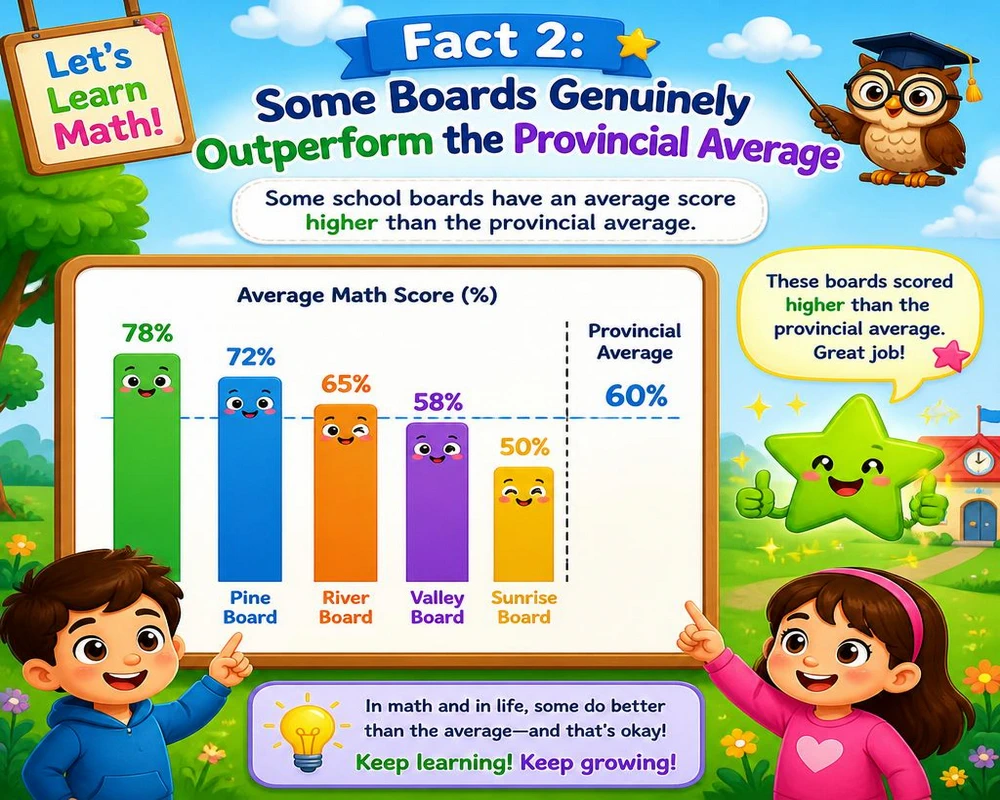
Individual boards do report real, verified gaps against the provincial standard. For example, the Halton District School Board reported that its Grade 9 math results exceeded the provincial average by 16 percentage points in the 2024-2025 results, a genuinely significant gap rather than statistical noise, and exactly the kind of concrete number that makes real Ontario math achievement by school board comparisons possible.
What This Means for Ontario Math Achievement by School Board Comparisons
A gap like this shows these differences are real, not just random year-to-year fluctuation. It doesn’t mean every student in a stronger-performing board is automatically ahead, or that every student in another board is behind — averages describe a whole board, not any individual child, and treating them otherwise risks drawing the wrong conclusion about a specific student’s actual potential.
Fact 3: Year-Over-Year Improvement Matters as Much as the Raw Score
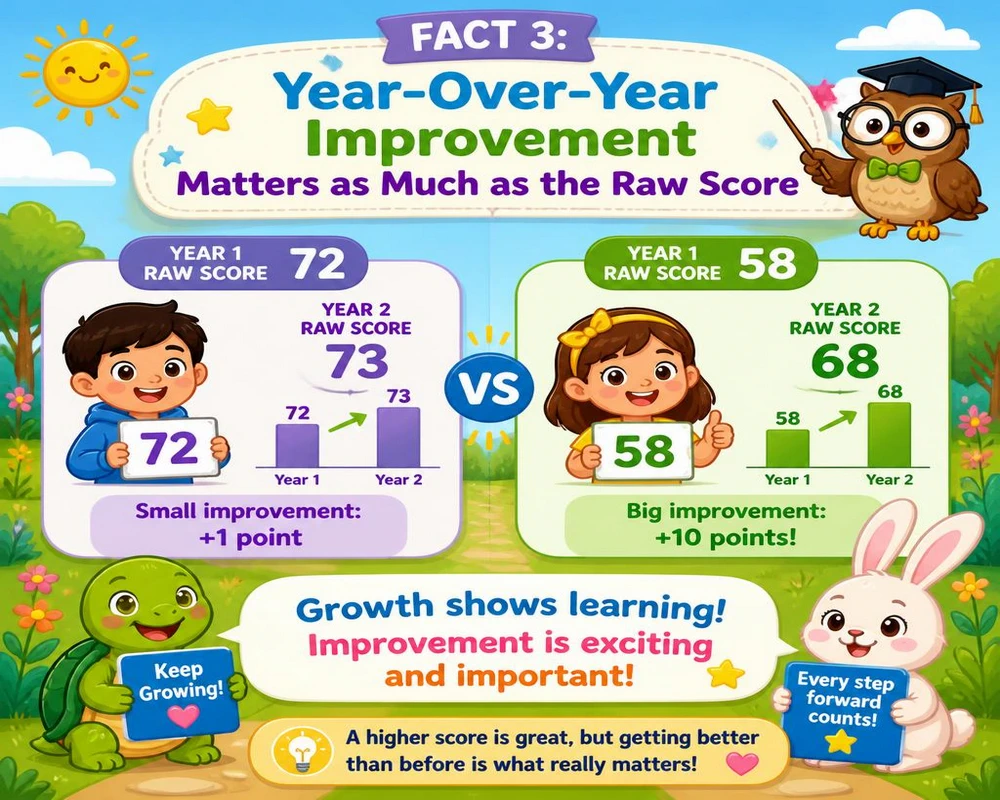
Several boards specifically highlighted math improvement, not just their absolute score, in their 2024-2025 results. The Ottawa-Carleton District School Board reported a 6 percentage point increase in Grade 9 math specifically, tied to a dedicated Math Achievement Action Plan. The Waterloo Region District School Board reported similar gains tied to its own structured math strategy, reinforcing that Ontario math achievement by school board figures are genuinely dynamic, not fixed year to year.
Why Trend Direction Is a Genuinely Useful Second Data Point
A board with a currently average score but a strong upward trend may be a genuinely different situation than a board with the same score that’s been flat or declining, even though the single-year number looks identical.
Fact 4: There’s No Single, Complete Public Ranking for Ontario Math Achievement by School Board
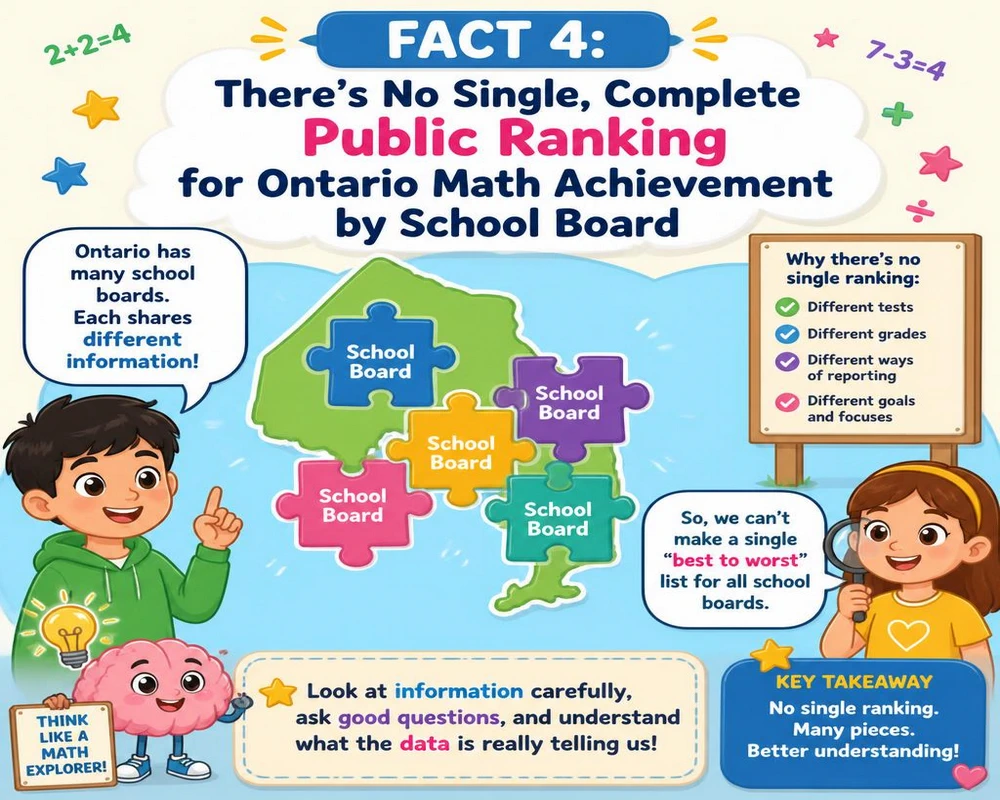
Despite how often “best school board for math Ontario” gets searched, EQAO doesn’t publish a simple, ranked leaderboard of every board’s math scores. Numbers exist for each board individually, but assembling them into one ranked list requires pulling data directly from EQAO’s own board-level search tool, since no single official summary ranks all boards head-to-head.
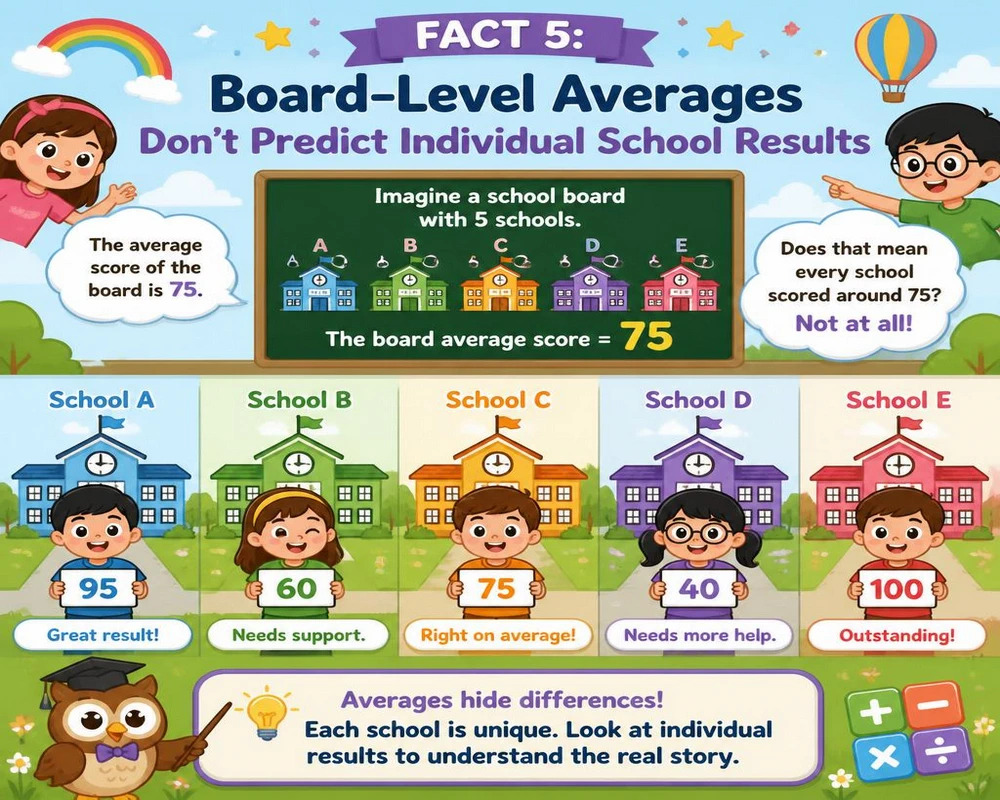
Fact 5: Board-Level Averages Don’t Predict Individual School Results
A school board average blends results across dozens or even hundreds of individual schools, some performing well above the board average and others below it. A specific school within a strong-performing board can still underperform, and vice versa, which is exactly why Ontario math achievement by school board data works best as a starting point rather than a final answer.
Why This Matters for Ontario Math Achievement by School Board Research
Families choosing a school based partly on academic performance get a more accurate picture from school-level EQAO data, not just the board-wide average, since the board number is really just a starting point for further research, not a substitute for looking directly at the specific school under consideration.
How to Check Your Own Ontario Math Achievement by School Board Data
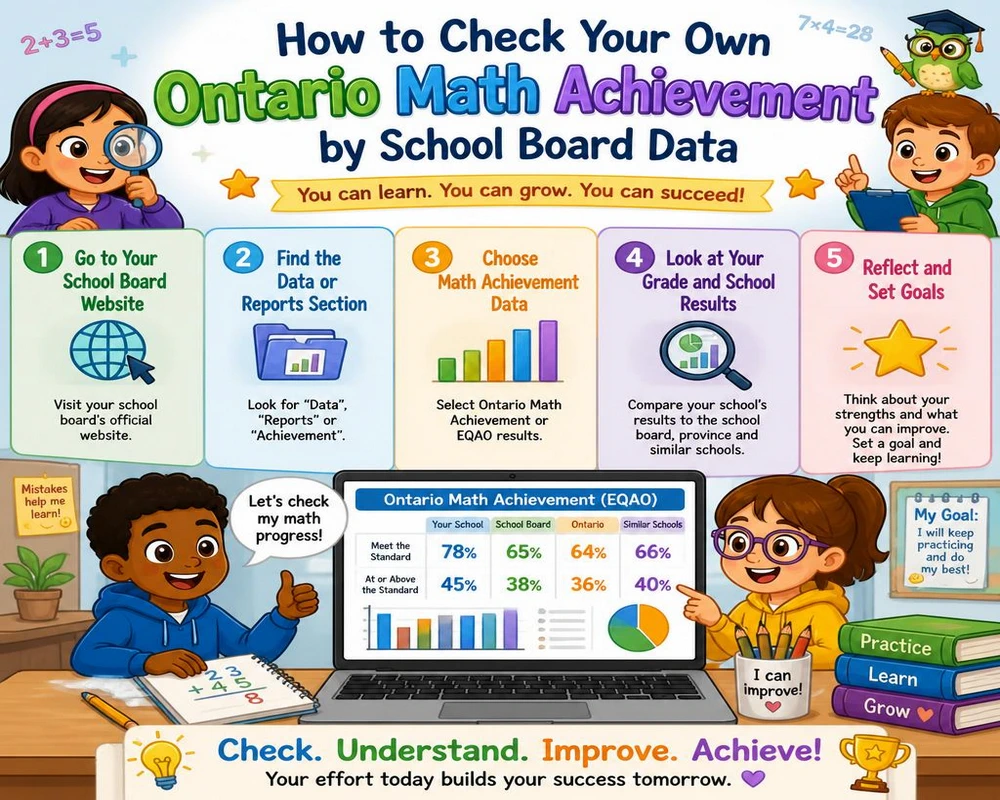
Step 1: Visit EQAO’s Official Results Search
EQAO provides a public search tool where board-level and school-level results can be looked up directly, filtered by year, grade, and subject, making genuine Ontario math achievement by school board research possible in just a few clicks.
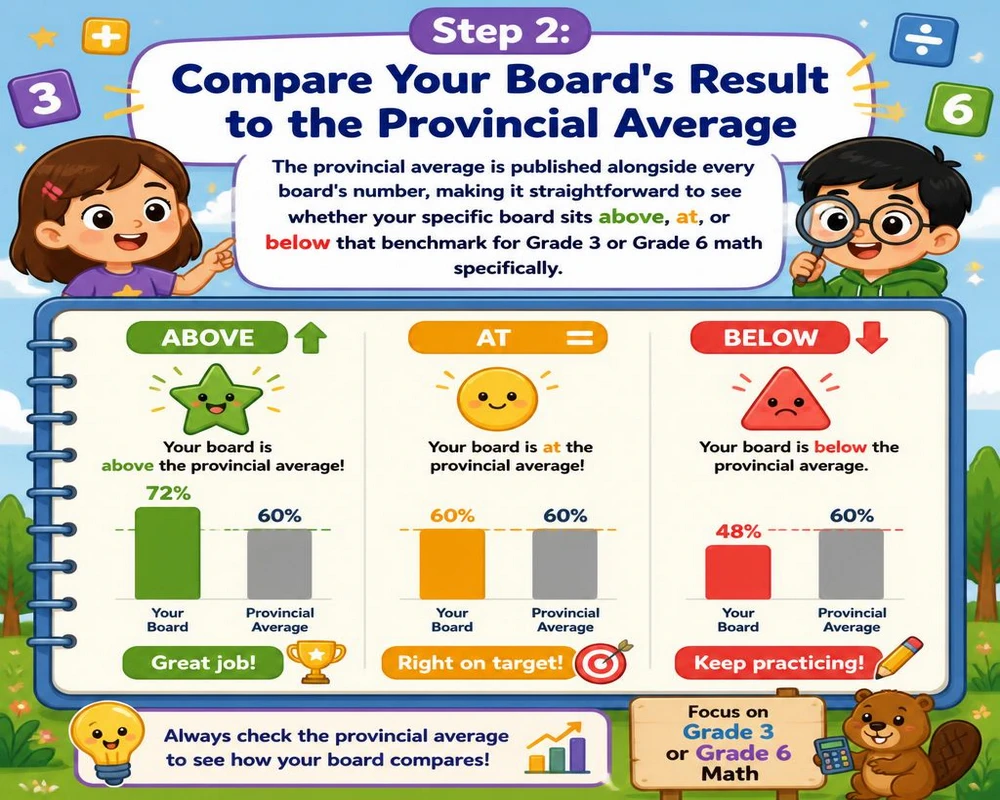
Step 2: Compare Your Board’s Result to the Provincial Average
The provincial average is published alongside every board’s number, making it straightforward to see whether your specific board sits above, at, or below that benchmark for Grade 3 or Grade 6 math specifically.
Step 3: Check the Trend Over the Last Two to Three Years
A single year’s snapshot is less informative than a short trend line. Most board and EQAO reporting includes at least the prior year for direct comparison, letting you see whether a board is improving, flat, or declining over time.
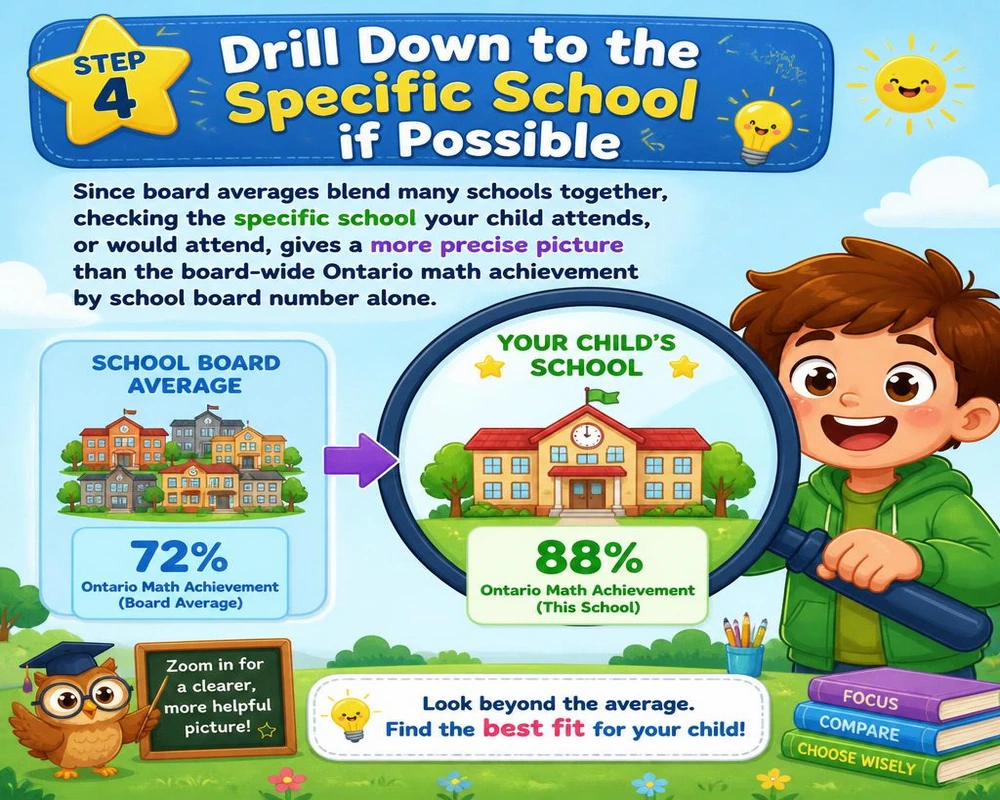
Step 4: Drill Down to the Specific School if Possible
Since board averages blend many schools together, checking the specific school your child attends, or would attend, gives a more precise picture than the board-wide Ontario math achievement by school board number alone.
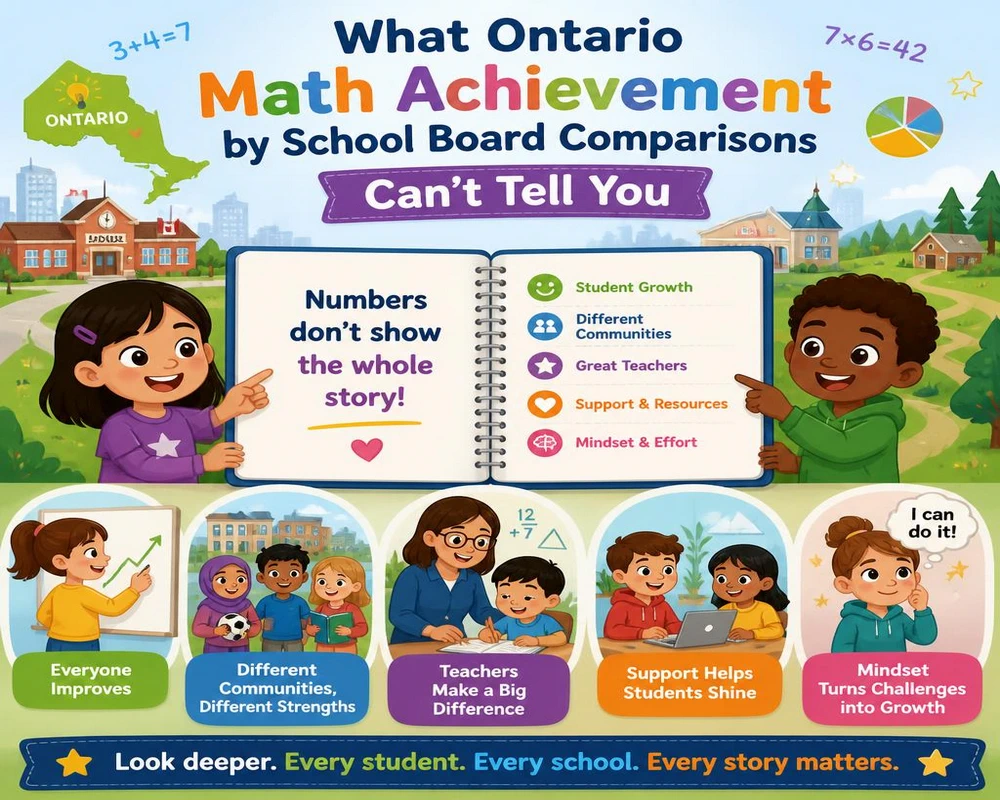
What Ontario Math Achievement by School Board Comparisons Can’t Tell You
They Don’t Account for Student Population Differences
Boards serve genuinely different communities, with different levels of resources, English-language learner populations, and socioeconomic factors, all of which can influence aggregate scores independent of teaching quality alone. This is a genuine limitation of any raw Ontario math achievement by school board comparison that doesn’t account for these underlying differences.
They Don’t Predict How a Specific Child Will Perform
A board average is a population-level statistic. An individual child’s actual performance depends on far more than which board they’re enrolled in, including the specific teacher, classroom, and the support a family provides at home. No Ontario math achievement by school board figure can substitute for that kind of individual-level insight.
They Can Change Meaningfully Year to Year
As the Ottawa-Carleton and Waterloo Region examples show, a board’s math results can shift several percentage points in a single year, especially when a board implements a dedicated improvement plan, so last year’s ranking may not hold going forward. This volatility is another reason a single-year snapshot of Ontario math achievement by school board data should be treated with some caution rather than as a permanent verdict.
Why This Data Matters Beyond Simple Comparison
Understanding Ontario math achievement by school board isn’t just useful for ranking boards against each other. It also helps explain why a family moving between boards, or a student transferring schools, might notice a genuinely different pace or emphasis in math instruction, even when both boards are following the same provincial curriculum. Board-level improvement plans, like the ones referenced above from Ottawa-Carleton and Waterloo Region, often shape classroom-level decisions about pacing, intervention support, and how quickly a struggling student gets additional help. Knowing your board’s general trend, whether improving, stable, or declining, can inform how proactively a family might want to supplement classroom learning at home.
Frequently Asked Questions
1. Where can I find my school board’s exact EQAO math results?
EQAO’s official results search tool provides board-level and school-level data directly, filterable by grade, subject, and year, and is the most accurate source for Ontario math achievement by school board rather than any secondhand summary.
2. Is there an official ranking of all Ontario school boards by math scores?
No, EQAO publishes individual board results but doesn’t produce a single ranked leaderboard comparing every board head-to-head, so assembling a full comparison requires checking each board’s published numbers directly.
3. Do some boards genuinely perform better in math than others?
Yes, real and sometimes substantial gaps exist between individual boards and the provincial average, as seen in board-published results, though these differences reflect many factors beyond teaching quality alone.
4. Should I choose a school based on board-level EQAO averages?
Board averages are a reasonable starting point, but school-level results give a more precise picture, since board-wide numbers blend performance across many individual schools that can vary considerably.
5. How often does EQAO update school board results?
Results are published annually, typically in the fall or early winter following the previous spring’s assessment cycle, covering the most recently completed school year.
6. Can a school board’s math results change quickly?
Yes, some boards have reported meaningful year-over-year gains, in some cases several percentage points, particularly when tied to a dedicated math improvement strategy.
7. Where can I find Ontario curriculum-aligned math practice regardless of my board’s average?
Our Ontario math practice platform offers curriculum-aligned lessons for every grade, useful for reinforcing math skills at home regardless of Ontario math achievement by school board averages. Explore Grade 1, Grade 2, Grade 3, Grade 4, Grade 5, and Grade 6 practice hubs directly.
For the complete, official, board-by-board EQAO results this article references, visit EQAO’s official results portal directly to search your specific board and school for the most current, accurate figures available.