
Grade 5 Data Management Practice: One Real Week of Data
Most Grade 5 data management practice sheets hand students a random, made-up list of numbers with no story attached. Here’s a better approach: one real, believable dataset, used from start to finish, so every concept — mean, median, mode, range, and graphing — connects back to the same numbers instead of resetting with each new topic.
The dataset below tracks one family’s daily step count for a week. Every section of this guide uses these same seven numbers, so by the end, you’ll have worked through a complete, connected picture of what Grade 5 data management practice actually covers.
The Dataset: One Week of Daily Steps
| Day | Steps Walked |
|---|---|
| Monday | 4,200 |
| Tuesday | 6,800 |
| Wednesday | 5,100 |
| Thursday | 6,800 |
| Friday | 7,300 |
| Saturday | 9,500 |
| Sunday | 3,200 |
This is exactly the kind of real, trackable data that makes Grade 5 data management practice feel meaningful rather than abstract — your own family could collect an identical dataset in a single week using any basic step counter.
Why Grade 5 Data Management Practice Needs Real Numbers Like These
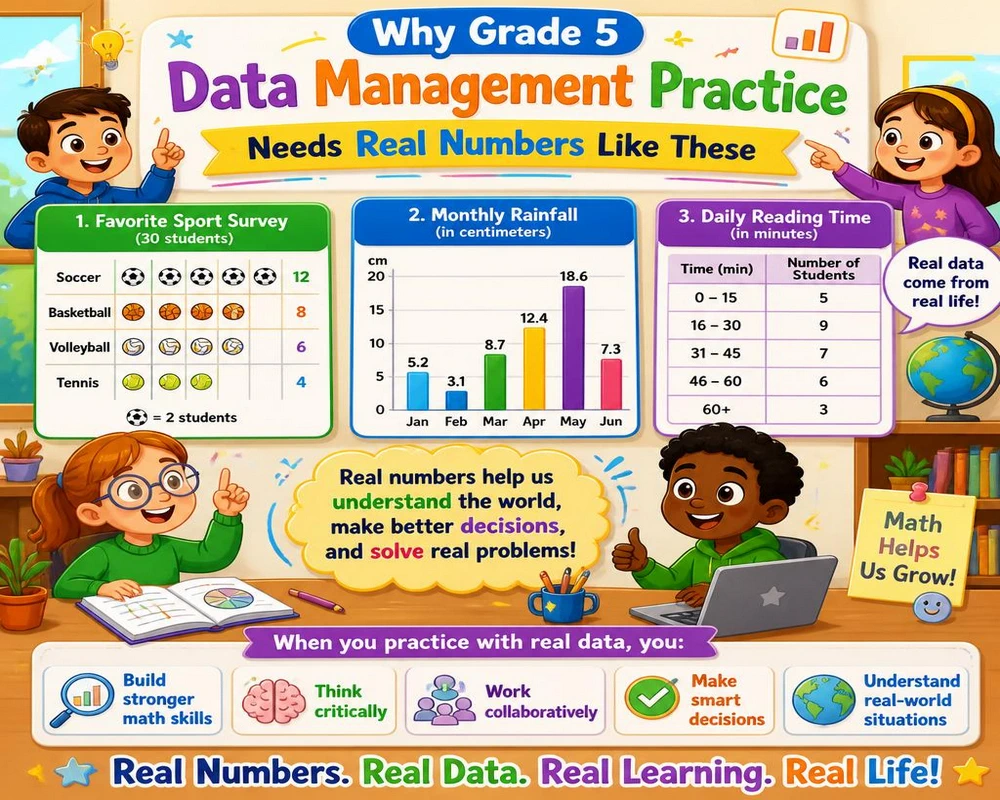
Ontario’s curriculum expects Grade 5 students to calculate mean, identify median and mode, determine range, and construct and interpret graphs — all as ways of summarizing a real set of data. Learning these tools using seven random, disconnected numbers each time misses the whole point. Grade 5 data management practice works best when the same dataset gets analyzed from multiple angles, the way a real question about real information actually would be.
What the Ontario Curriculum Expects in Grade 5
By the end of Grade 5, students are generally expected to:
- Calculate the mean (average) of a data set
- Identify the median and mode of a data set
- Determine the range of a data set
- Construct and interpret graphs with an appropriate scale
- Use these measures together to describe and compare data
Finding the Mean: Steps 1, 2, 3
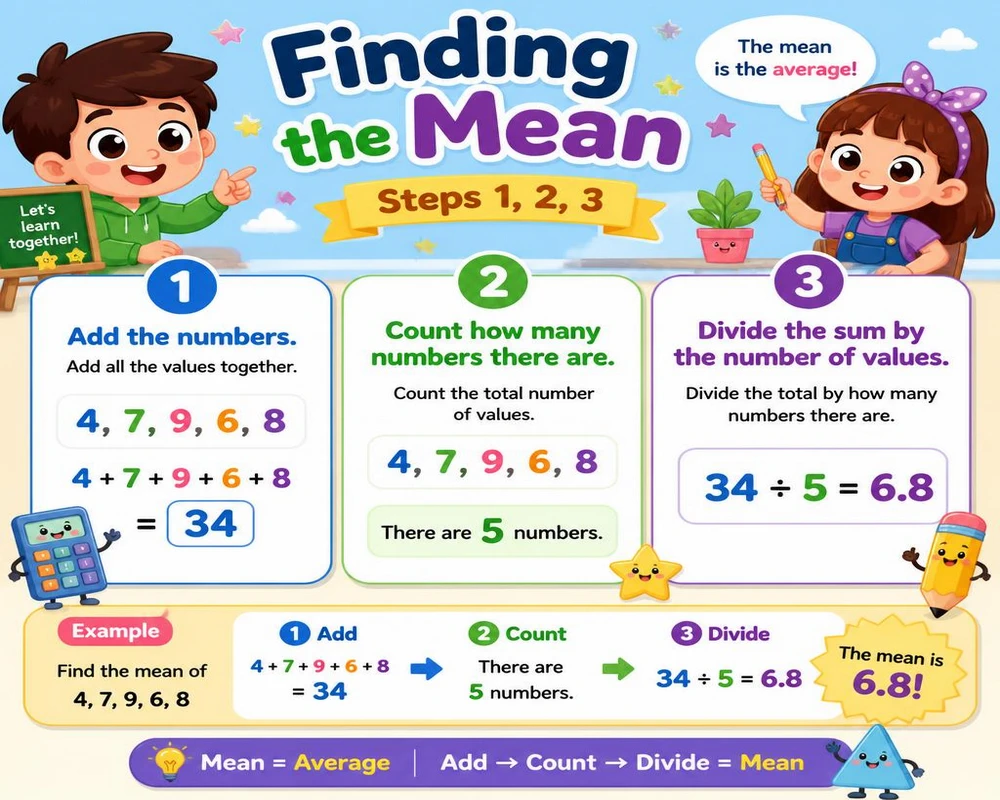
The mean is what most people mean when they say “average,” and it’s the first of four key measures in Grade 5 data management practice — add every value together, then divide by how many values there are.
- Add all seven values: 4,200 + 6,800 + 5,100 + 6,800 + 7,300 + 9,500 + 3,200 = 42,900
- Divide by the number of days: 42,900 ÷ 7
- Result: approximately 6,129 steps per day
Practice Questions Using the Same Dataset
- What is the mean number of steps for this week, rounded to the nearest whole step?
- If Monday’s total had been 5,200 instead of 4,200, would the mean increase or decrease?
Answers: 1) About 6,129 steps 2) Increase, since the total sum would be larger while the number of days stays the same
Finding the Median: Ordering the Data
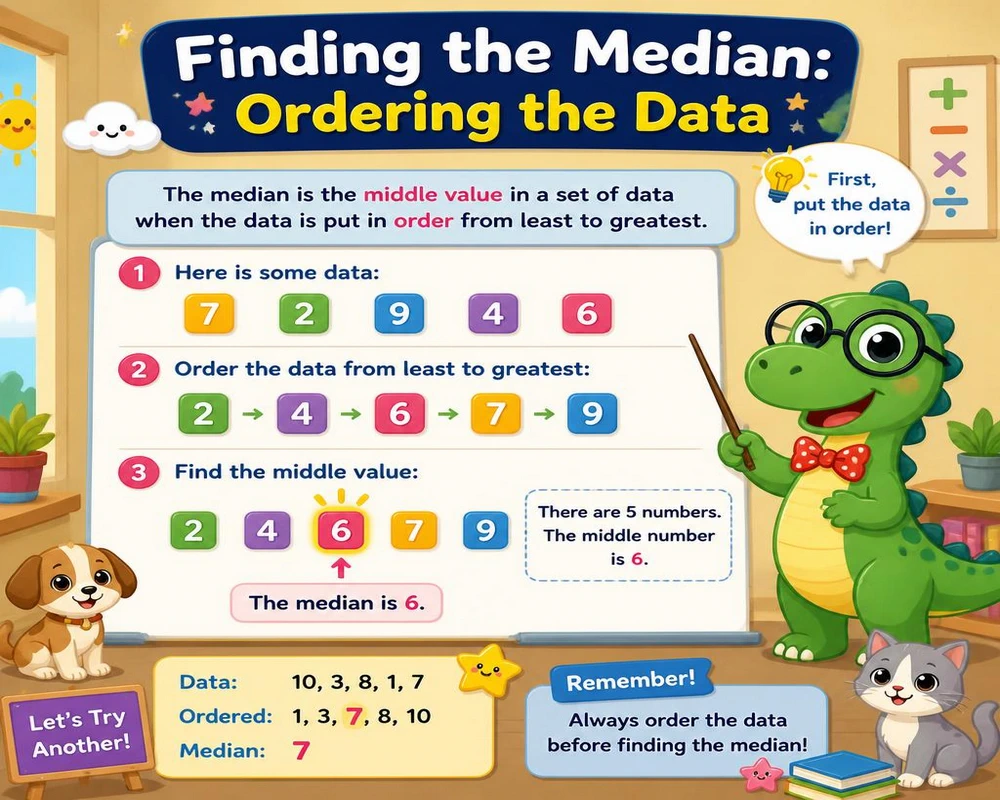
The median is the second core measure in Grade 5 data management practice — the middle value once all the numbers are arranged in order, and one that ignores extreme values entirely.
Ordering the Steps Data
Arranged from smallest to largest: 3,200 4,200 5,100 6,800 6,800 7,300 9,500
With seven values, the median is the 4th number in the ordered list: 6,800 steps.
Practice Questions
- Why is 6,800 the median, and not the mean of 6,129?
- If Saturday’s step count were removed entirely, leaving 6 days, how would you find the median of the remaining data?
Answers: 1) Because it’s the middle value when the data is ordered, not a calculated average 2) Order the remaining 6 values and average the two middle numbers, since an even number of values has no single middle point
Finding the Mode: What Repeats
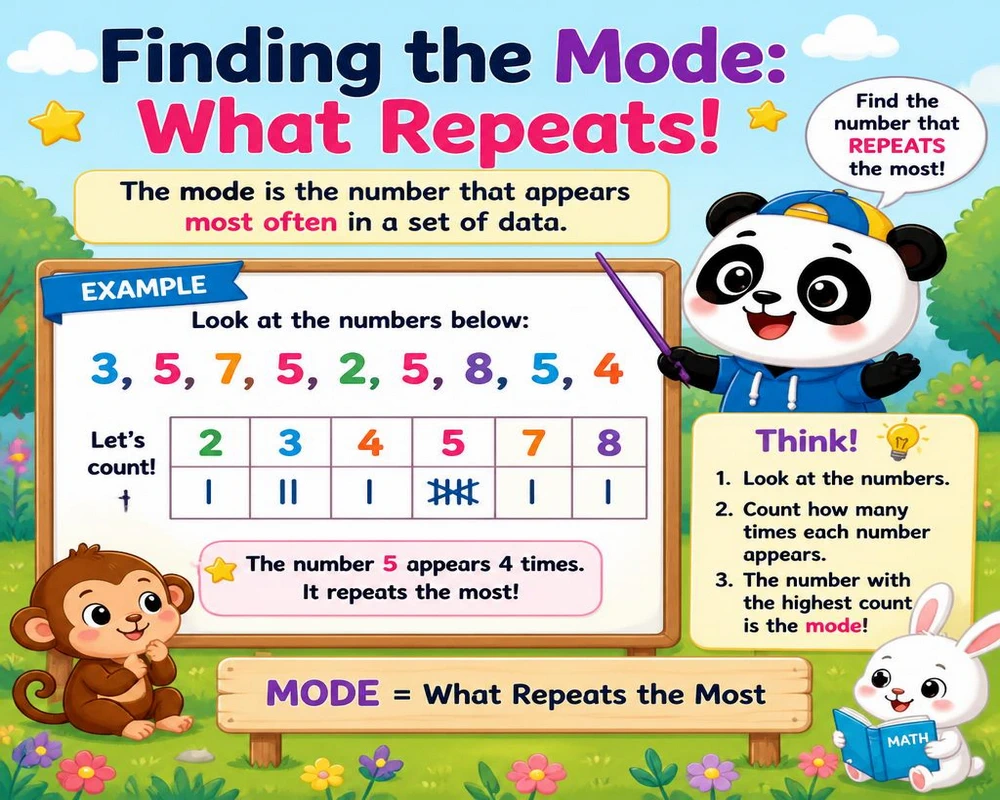
The mode is the third measure in Grade 5 data management practice — whichever value appears most often. In this dataset, 6,800 shows up twice (Tuesday and Thursday), while every other value appears only once.
Practice Questions
- What is the mode of this week’s step data?
- Is it possible for a data set to have no mode at all, or more than one mode?
Answers: 1) 6,800 steps 2) Yes to both — a data set with no repeated values has no mode, and a data set with two equally frequent values has two modes
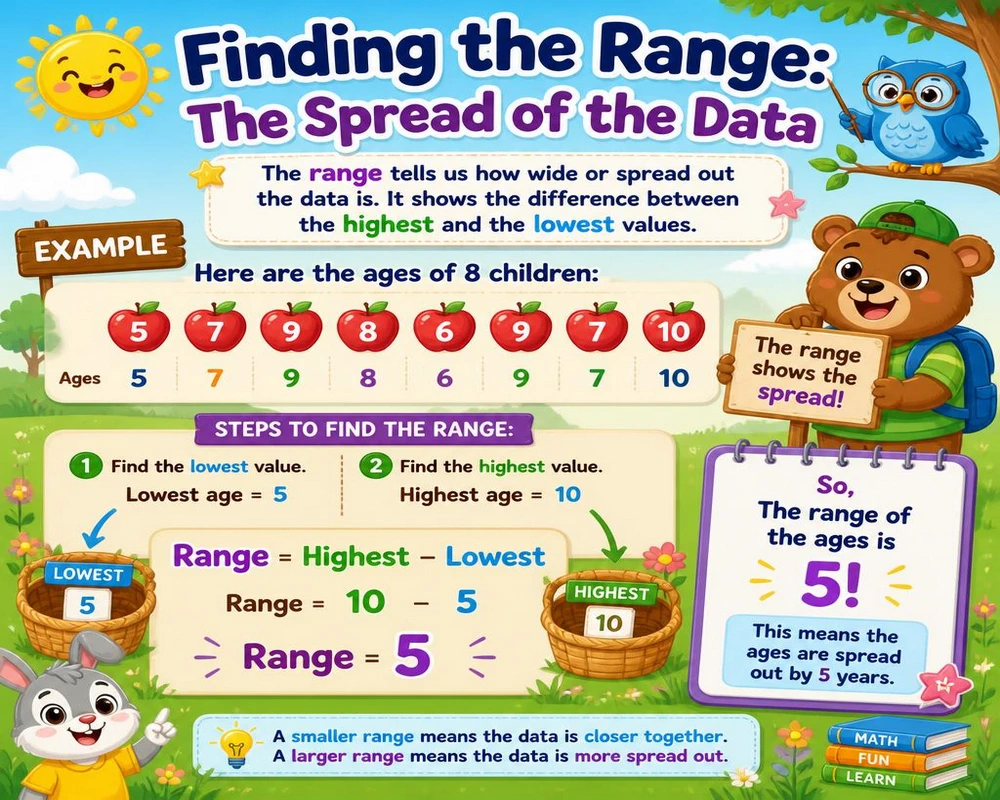
Finding the Range: The Spread of the Data
Range rounds out the four core measures of Grade 5 data management practice, showing how spread out the data is by subtracting the smallest value from the largest.
Practice Questions
- What is the range of this week’s step data?
- Which day represents the highest value, and which represents the lowest?
Answers: 1) 9,500 − 3,200 = 6,300 steps 2) Saturday (highest, 9,500) and Sunday (lowest, 3,200)
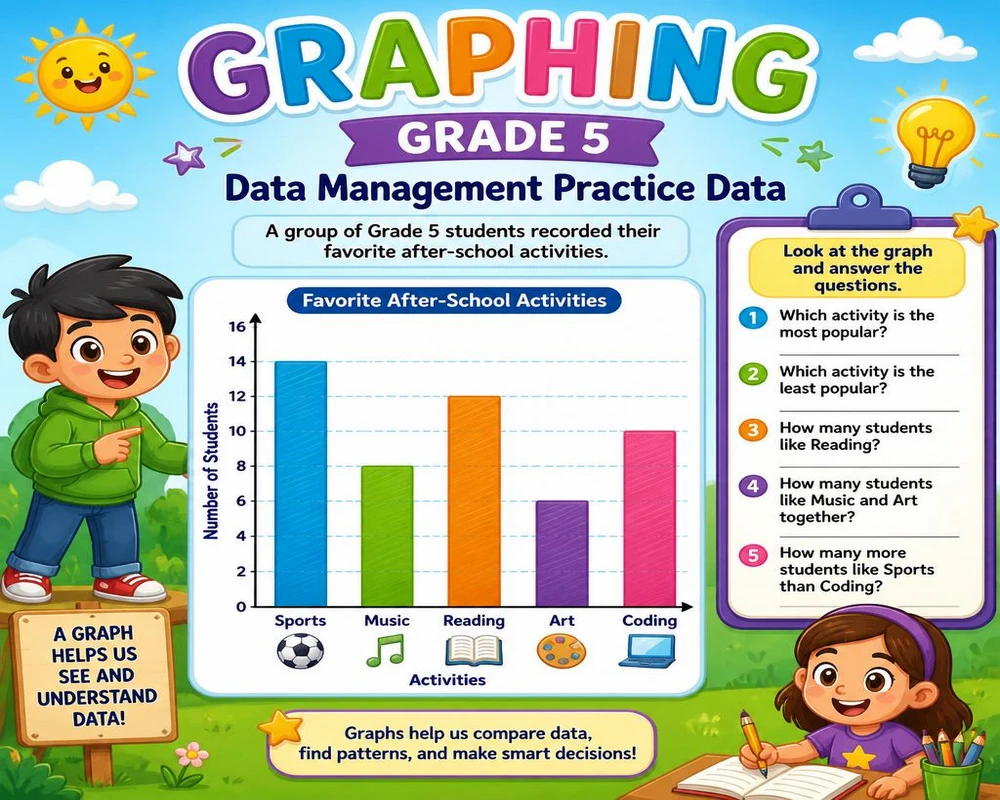
Graphing Grade 5 Data Management Practice Data
Turning this same dataset into a bar graph is where Grade 5 data management practice connects directly to visual interpretation, tying every earlier calculation to something you can actually see. If each square on a graph represents 1,000 steps, Saturday’s bar would reach about 9.5 squares, while Sunday’s would reach only about 3.2 squares.
Practice Questions
- If each square on a graph equals 1,000 steps, how many squares should Friday’s bar reach?
- Which two days would have bars of nearly identical height on this graph?
Answers: 1) About 7.3 squares 2) Tuesday and Thursday, both at 6,800 steps
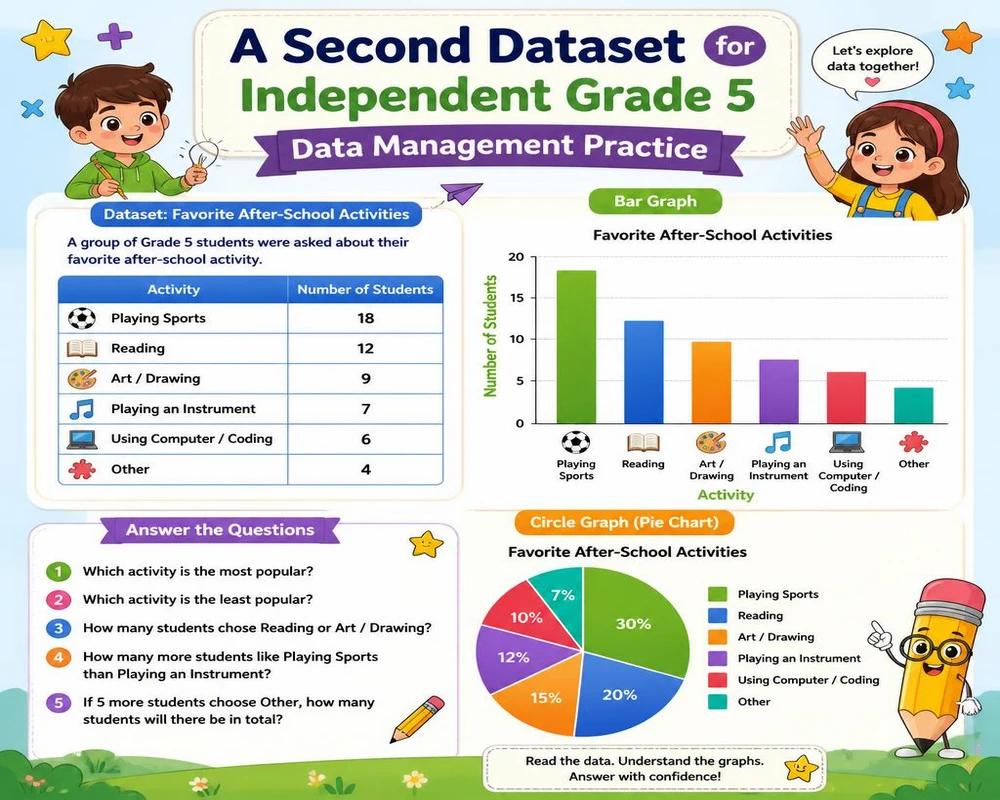
A Second Dataset for Independent Grade 5 Data Management Practice
Once the steps example feels solid, try the same four measures with a fresh data set: seven quiz scores out of 100 — 78, 85, 92, 78, 85, 85, 90.
- What is the mean of these seven scores?
- What is the median?
- What is the mode?
- What is the range?
Answers: 1) About 84.7 2) 85 3) 85 (appears three times) 4) 14
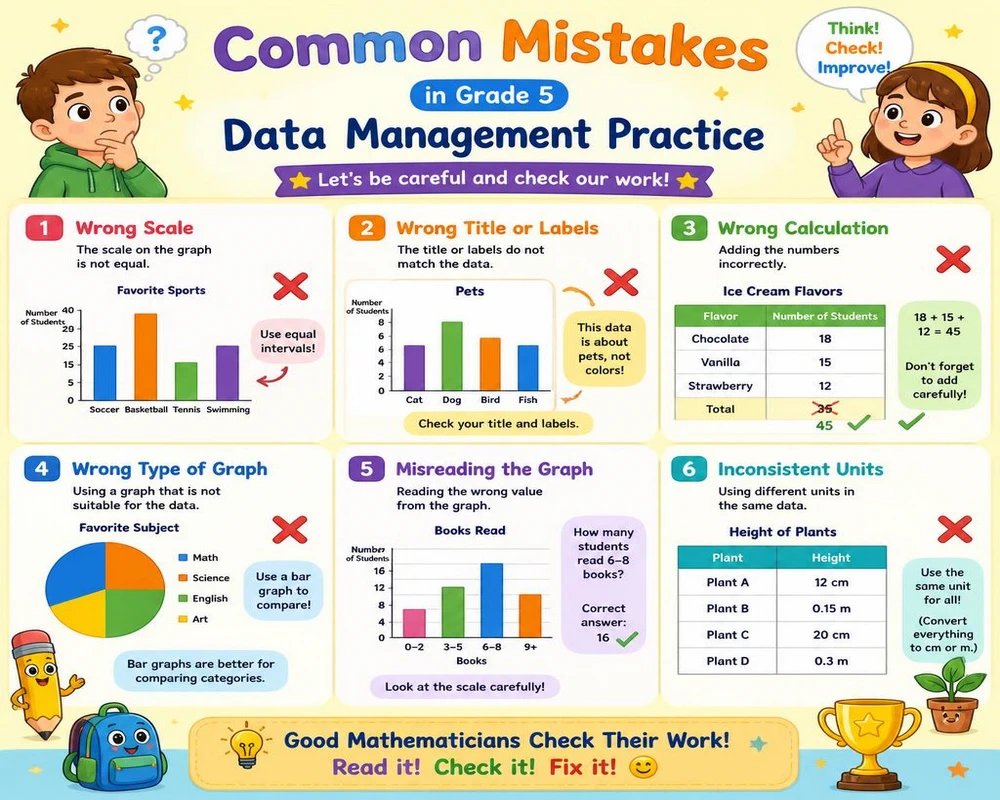
Common Mistakes in Grade 5 Data Management Practice
Three specific errors show up repeatedly across Grade 5 data management practice sessions, and each one is worth watching for directly.
Confusing Mean, Median, and Mode
Since all three describe a data set in some way, students often mix them up. Practicing all three on the exact same data set, as this guide does, makes the differences between them far clearer than practicing each in isolation.
Forgetting to Order Data Before Finding the Median
The median only works correctly on ordered data. Skipping this step is one of the most common errors in Grade 5 data management practice, and it produces a plausible-looking but incorrect answer.
Misreading a Scaled Bar Graph
When each square represents more than one unit, students sometimes count squares directly instead of multiplying by the scale. Practicing scaled graphs specifically, using a real dataset like the one above, helps prevent this.
Frequently Asked Questions
1. What’s the difference between mean, median, and mode?
These three measures sit at the center of Grade 5 data management practice. Mean is the calculated average, median is the middle value when data is ordered, and mode is the most frequently occurring value. All three can be different numbers for the same data set.
2. Why does Grade 5 data management practice cover all three measures instead of just one?
Each measure reveals something different about a data set. Mean can be affected by extreme values, while median and mode are more resistant, so comparing all three gives a fuller picture — which is exactly why Grade 5 data management practice treats them as a connected set of tools rather than separate topics.
3. How can I create a real dataset like the one in this guide?
Track something simple for a week — steps, screen time, hours of sleep — using a phone app or a basic log, then calculate mean, median, mode, and range from your own real numbers.
4. Why does my child forget to order the data before finding the median?
This is a common shortcut that produces incorrect results. Reinforcing “order first, then find the middle” as a fixed two-step habit helps prevent this error.
5. Can a data set have more than one mode?
Yes, if two or more values appear with the same highest frequency, the data set has more than one mode.
6. How much data management practice should we do at home?
About 15-20 minutes, a few times a week, tends to work well, especially when built around one connected, real dataset rather than several unrelated worksheets.
7. How does this connect to Grade 6?
Grade 6 builds on these same measures with more complex data sets and deeper comparisons between multiple graphs, so a solid grasp of mean, median, and mode now pays off directly.
Data management is one part of a full Grade 5 year that also includes decimals, fractions, and probability. Working through mean, median, mode, and range on one connected dataset, as this Grade 5 data management practice guide does, builds far more durable understanding than isolated worksheets. Our Grade 5 math practice hub covers every topic in one place.
Real Canadian data makes graphing and statistics practice feel far less abstract. Statistics Canada’s education resources offer kid-friendly datasets that pair well with the mean, median, and mode work covered in this guide.