Grade 1 Data Management Practice: 5 Simple Activities
Grade 1 data management practice often gets mistaken for something far more complicated than it actually is. Parents hear “data” and picture spreadsheets and charts, when really, at this age, it looks a lot more like sorting a pile of laundry by colour or counting how many red versus blue candies are left in a bag. Having spent years supporting Ontario’s Primary Division classrooms, I’ve noticed this is one of the more approachable units in the curriculum — kids are often doing informal data management naturally, long before anyone puts a name to it.
This guide breaks down exactly what Ontario’s Grade 1 curriculum expects around data, why it matters more than it seems, and how to turn everyday sorting and counting into genuine practice at home.
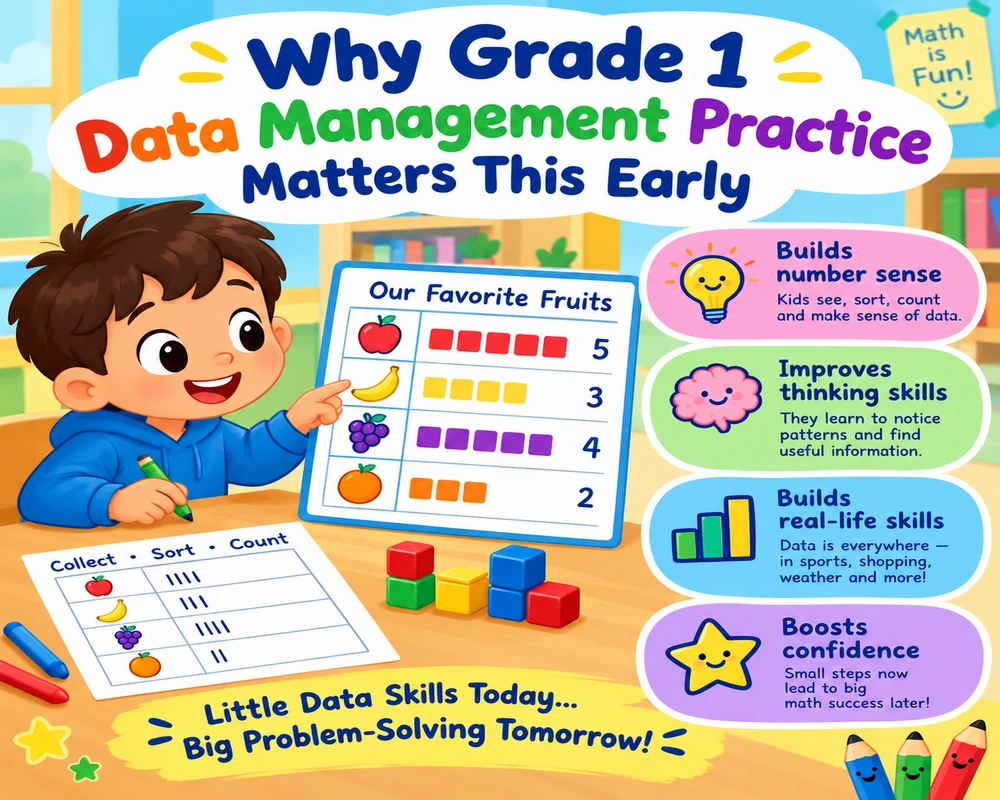
Why Grade 1 Data Management Practice Matters This Early
Data falls under its own dedicated strand in Ontario’s 2020 math curriculum, and Grade 1 is where students take their very first steps toward organizing information and drawing simple conclusions from it. At this stage, there’s no complicated graphing software or statistical formulas involved — the goal is simply to help kids notice that grouping and counting information can answer real questions, like “which colour do most of my classmates like best?”
This distinction matters because a child who builds genuine comfort with sorting and simple counting now tends to find bar graphs and more complex data interpretation far less intimidating when they show up formally in Grade 2 and 3.
What the Ontario Curriculum Expects in Grade 1
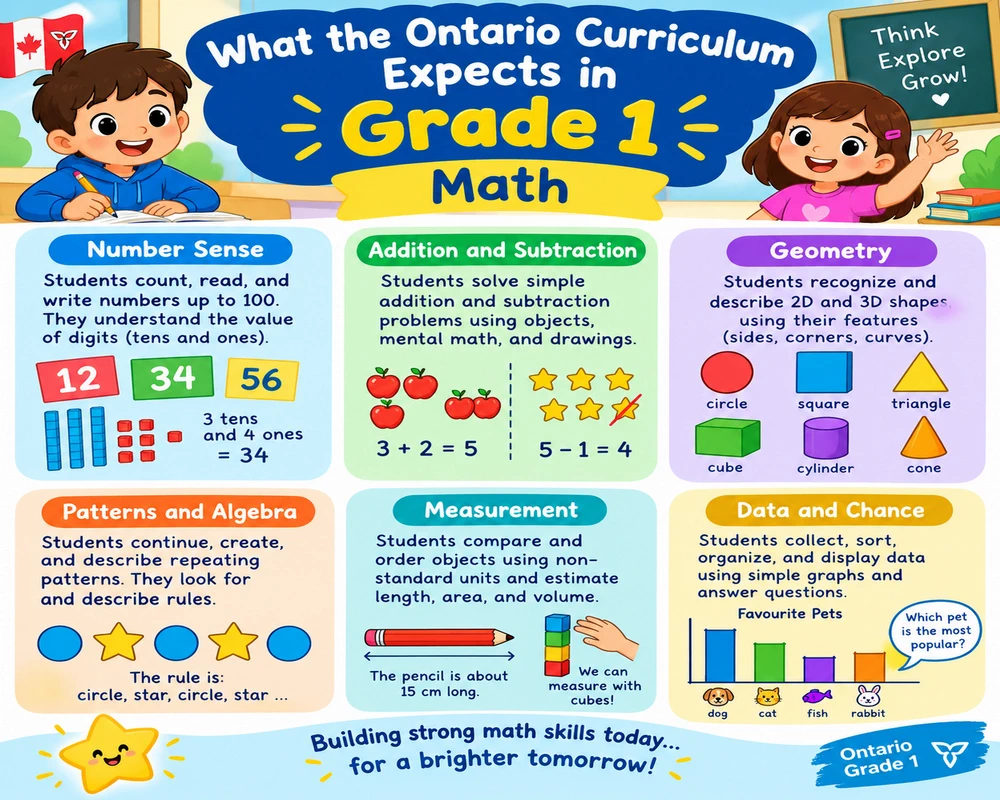
By the end of Grade 1, students are generally expected to:
- Sort and classify objects using one attribute (colour, size, shape)
- Collect data by asking simple survey-style questions
- Organize collected data using concrete objects or simple pictures
- Read and answer questions about simple concrete or pictorial graphs
- Compare groups to say which has more, less, or the same
Notice that formal bar graphs with labelled axes aren’t required yet. Grade 1 data management practice work is really about hands-on sorting and counting first, with graphing introduced only in its simplest, most visual form.
Sorting and Classifying: The Starting Point
Sorting by One Attribute
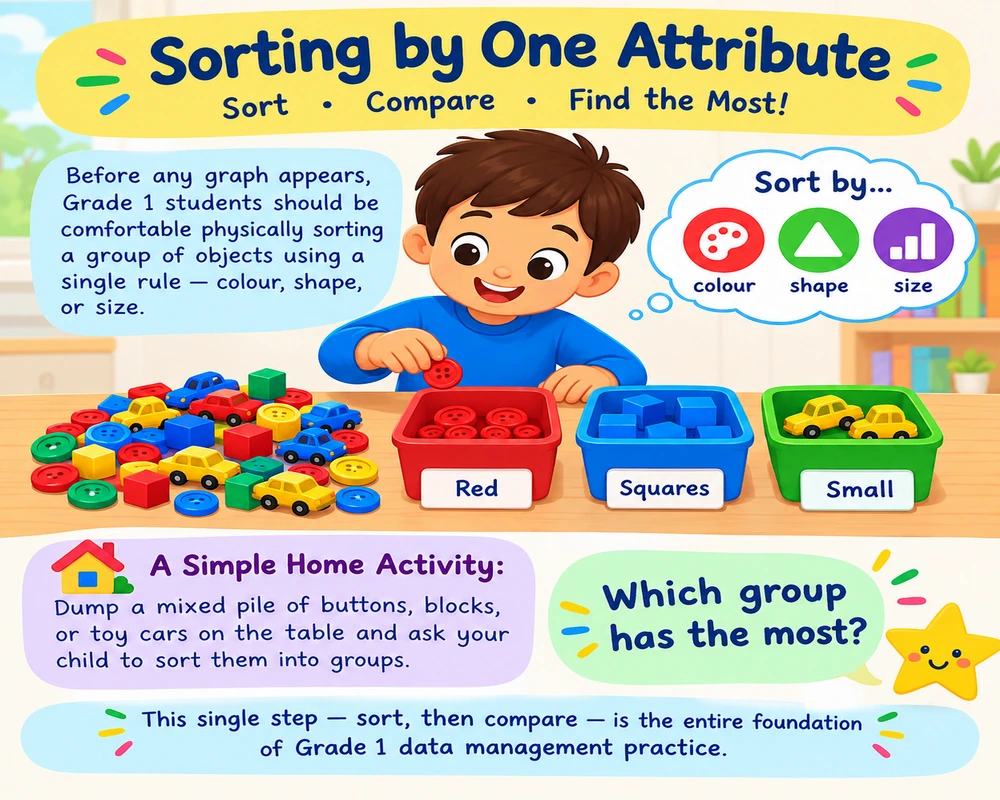
Before any graph appears, Grade 1 students should be comfortable physically sorting a group of objects using a single rule — colour, shape, or size.
A simple home activity: dump a mixed pile of buttons, blocks, or toy cars on the table and ask your child to sort them into groups. Then ask a follow-up question: “Which group has the most?” This single step — sort, then compare — is the entire foundation of Grade 1 data management practice.
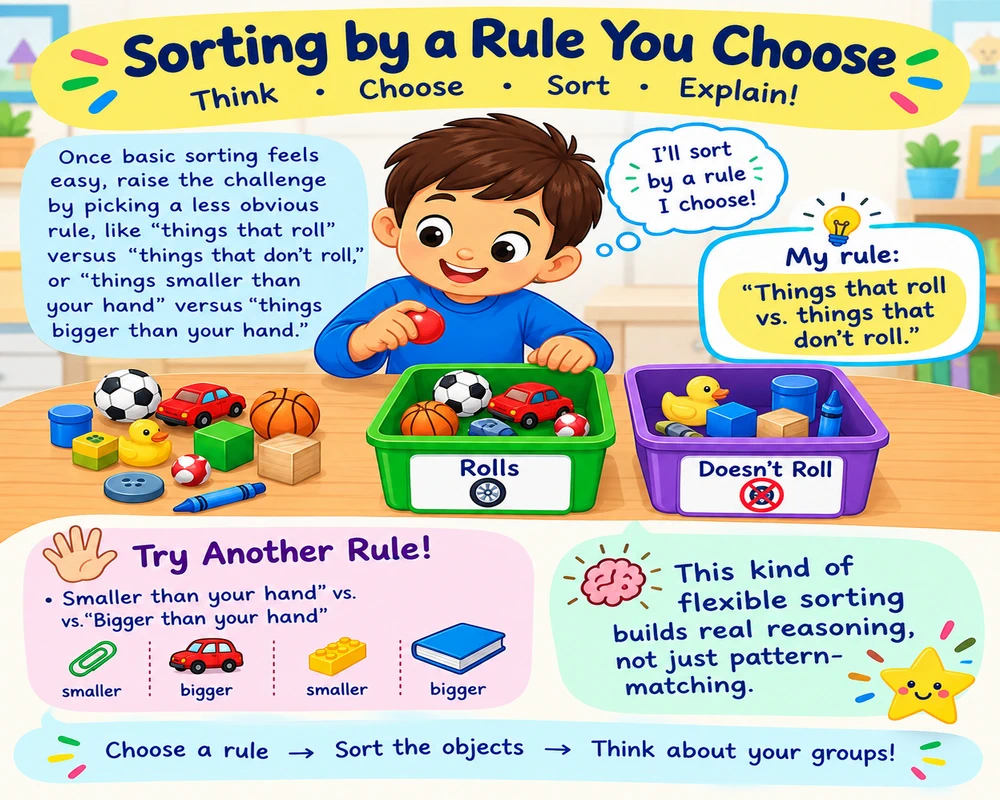
Sorting by a Rule You Choose
Once basic sorting feels easy, raise the challenge by picking a less obvious rule, like “things that roll” versus “things that don’t roll,” or “things smaller than your hand” versus “things bigger than your hand.” This kind of flexible sorting builds real reasoning, not just pattern-matching.
Collecting Simple Data: Asking and Counting
Running a Mini Survey
A great way to introduce data collection is having your child ask a simple yes/no or choice-based question to family members, then tally the results.
| Question | Family Member Answers |
|---|---|
| “What’s your favourite fruit: apple or banana?” | Apple, Apple, Banana, Apple |
| “Do you like pizza: yes or no?” | Yes, Yes, Yes, No |
Ask your child to count the tallies and answer: “Which was picked more often?” This mirrors, almost exactly, the kind of question Ontario’s Grade 1 data management practice expectations are built around.
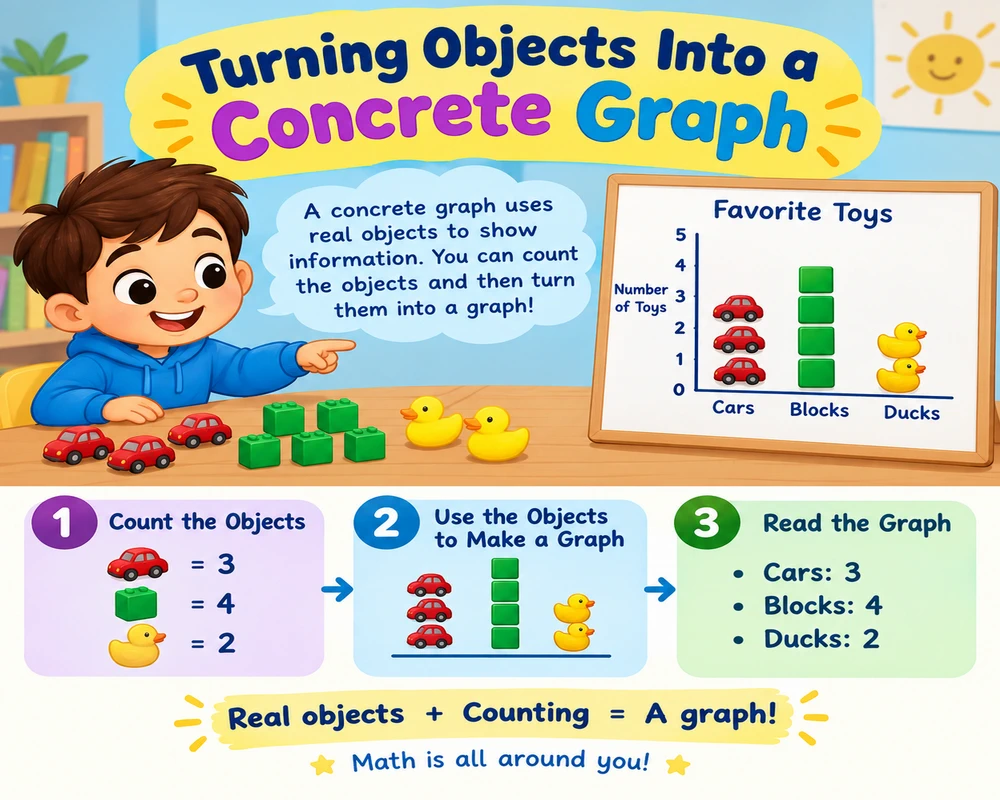
Turning Objects Into a Concrete Graph
Before pictures or bars, the simplest graph a Grade 1 student can build is a physical one — lining up real objects in rows to compare groups visually.
- Line up 4 red blocks and 6 blue blocks in two separate rows.
- Ask: “Which row is longer? What does that tell you?”
- Ask: “How many more blue blocks are there than red blocks?”
Answers: 2) The blue row 3) 2 more
Grade 1 Graphing Practice Questions
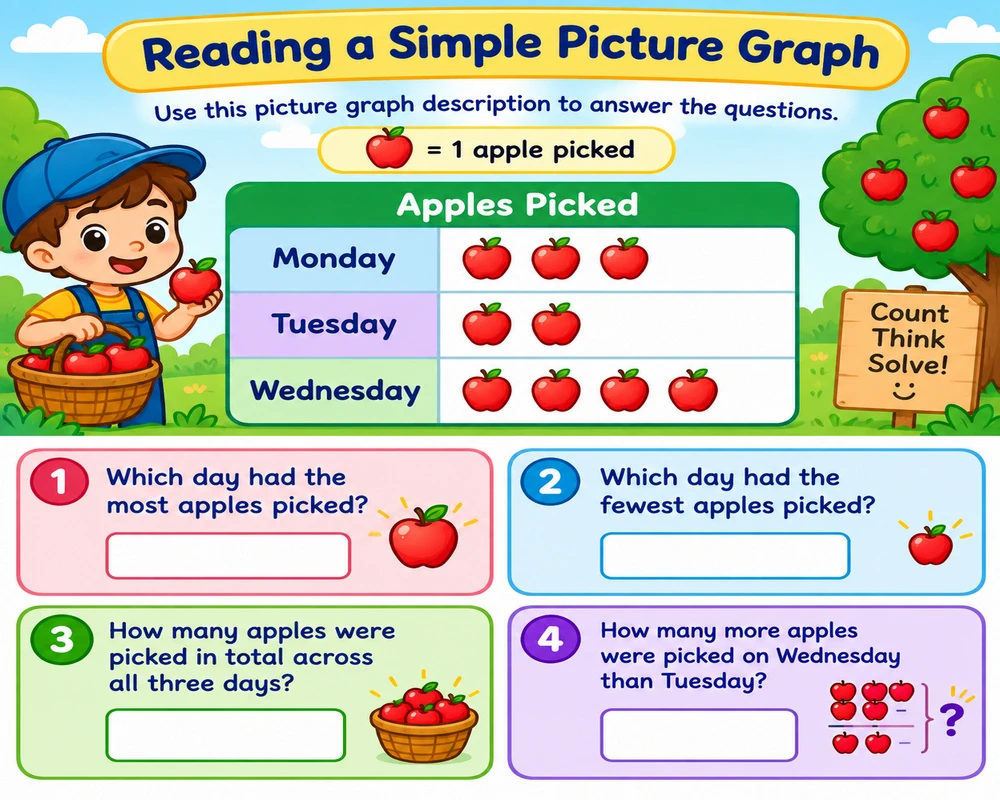
Reading a Simple Picture Graph
Use this picture graph description to answer the questions. Each 🍎 represents one apple picked.
Monday: 🍎🍎🍎
Tuesday: 🍎🍎
Wednesday: 🍎🍎🍎🍎
- Which day had the most apples picked?
- Which day had the fewest apples picked?
- How many apples were picked in total across all three days?
- How many more apples were picked on Wednesday than Tuesday?
Answers: 1) Wednesday 2) Tuesday 3) 9 4) 2
Comparing Groups Directly
- There are 5 dogs and 3 cats in a picture. Are there more dogs or cats?
- A basket has 7 oranges and 7 lemons. Are there more oranges, more lemons, or are they equal?
Answers: 1) More dogs 2) They are equal
Grade 1 Data Management Activities for Everyday Life
Sock Sorting
Laundry day is an unexpectedly perfect data management activity. Have your child sort socks by colour or pattern, then count and compare which group has the most.
Snack Time Tally
Before eating a small mixed snack (like trail mix or coloured candies), have your child sort by colour or type first, count each group, and predict which one there’s the most of before checking.
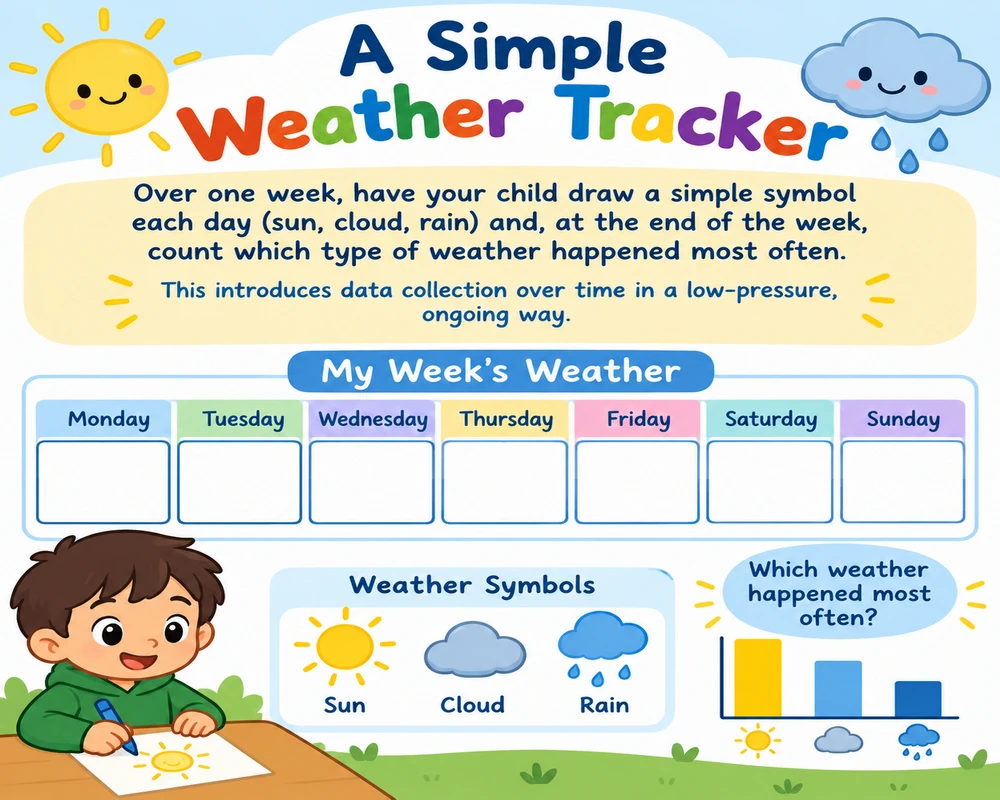
A Simple Weather Tracker
Over one week, have your child draw a simple symbol each day (sun, cloud, rain) and, at the end of the week, count which type of weather happened most often. This introduces data collection over time in a low-pressure, ongoing way.
Common Mistakes in Grade 1 Data Management Practice
Sorting by Two Rules at Once, Too Soon
Some children try to sort by colour and size simultaneously before they’re ready, leading to a jumbled result. Start with one clear rule at a time before introducing more complex sorting.
Miscounting Within a Group
Just like with basic counting, kids sometimes lose track partway through counting a sorted group. Encourage physically moving each counted item aside, exactly like the one-to-one correspondence strategy used elsewhere in early math.
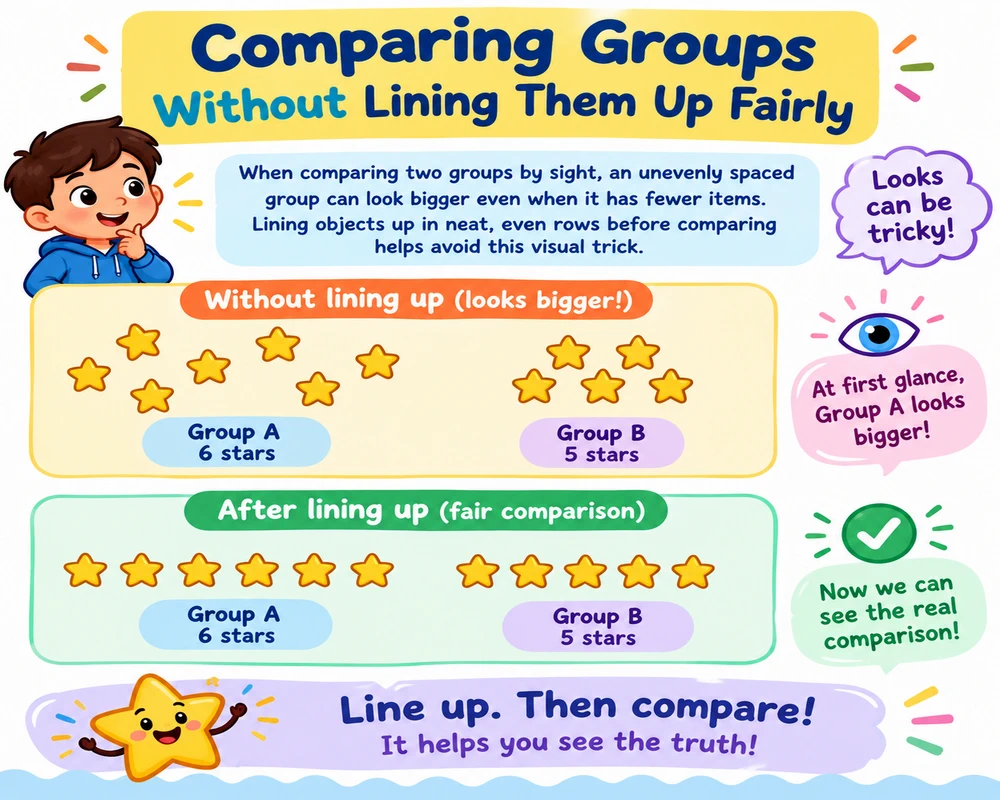
Comparing Groups Without Lining Them Up Fairly
When comparing two groups by sight, an unevenly spaced group can look bigger even when it has fewer items. Lining objects up in neat, even rows before comparing helps avoid this visual trick.
Practical Tips for Practicing at Home
Use What’s Already Around
Buttons, socks, crayons, toy cars — almost anything sortable in your house can become a quick round of Grade 1 data management practice without any special materials.
Ask Real Questions Your Child Cares About
Surveying about favourite snacks or favourite games tends to hold attention far better than an abstract example, since the data actually means something to your child.

Keep Sessions Short and Frequent
Ten minutes of sorting or a quick tally, a few times a week, is genuinely enough at this age — especially when folded into an activity that was happening anyway, like tidying up or snack time.
Simple sorting and graphing activities work especially well when paired with visual, hands-on tools. TVOKids, Ontario’s own children’s education platform, offers free sorting and pattern games designed specifically for young learners, making a great follow-up once your child has practiced with real objects at home.
Conclusion: Making Sense of Information Early
Data management is just one part of a full Grade 1 year that also covers shapes, patterns, measurement, and early money skills. For the complete picture, our Grade 1 math practice hub brings every topic together in one place.
Grade 1 data management practice teaches something far bigger than it first appears — that organizing information and comparing groups can actually answer real questions. That’s a genuinely useful life skill, not just a school topic. Give your child plenty of hands-on sorting and simple counting now, and reading graphs in later grades will feel like a natural next step rather than a brand-new challenge.
Pick a pile of anything sortable in your house tonight — socks, crayons, snacks — and spend ten minutes sorting and comparing together. This kind of simple, playful practice builds real understanding no worksheet alone can match.
Frequently Asked Questions
1. Does my Grade 1 child need to know how to read a bar graph?
Not formally yet. Grade 1 focuses on simple concrete or picture graphs, with formal bar graphs introduced more fully in Grade 2 and beyond.
2. What does “sorting by one attribute” mean?
It means grouping objects using a single rule at a time, like colour or size, rather than combining multiple rules at once, which comes later.
3. How can I introduce data collection without it feeling like homework?
Simple family surveys about favourite foods, games, or activities work well, since the questions feel real and relevant rather than abstract.
4. Why does my child struggle to compare two groups by sight?
This often happens when groups aren’t lined up evenly, making one look bigger even with fewer items. Lining objects up in neat rows before comparing usually fixes this.
5. What household items work well for data management practice?
Almost anything sortable works — buttons, socks, crayons, snacks, or toy cars are all perfect, low-cost options.
6. How much time should we spend on this at home each week?
About 10 minutes, a few times a week, tends to be enough, especially when built into routines like laundry or snack time.
7. How does Grade 1 data management connect to later grades?
It builds the sorting and counting foundation that supports formal bar graphs, pictographs, and more detailed data interpretation in Grade 2 and beyond.